U.S. flag

An official website of the United States government

Here’s how you know

Dot gov

Official websites use .gov
A .gov website belongs to an official government organization in the United States.

HTTPS

Secure .gov websites use HTTPS
A lock (LockA locked padlock) or https:// means you’ve safely connected to the .gov website. Share sensitive information only on official, secure websites.

    • Environmental Topics
    • Air
    • Bed Bugs
    • Cancer
    • Chemicals, Toxics, and Pesticide
    • Emergency Response
    • Environmental Information by Location
    • Health
    • Land, Waste, and Cleanup
    • Lead
    • Mold
    • Radon
    • Research
    • Science Topics
    • Water Topics
    • A-Z Topic Index
    • Laws & Regulations
    • By Business Sector
    • By Topic
    • Compliance
    • Enforcement
    • Laws and Executive Orders
    • Regulations
    • Report a Violation
    • Environmental Violations
    • Fraud, Waste or Abuse
    • About EPA
    • Our Mission and What We Do
    • Headquarters Offices
    • Regional Offices
    • Labs and Research Centers
    • Planning, Budget, and Results
    • Organization Chart
    • EPA History

Climate Change Indicators in the United States

  • Fifth Edition of the Climate Change Indicators Report

    EPA has released the fifth edition of its Climate Change Indicators in the United States Report. Dive in to see updated data, learn about connections, and review two brand new indicators to the collection.

    Read the report
  • Winters Getting Warmer

    Temperatures across the U.S. have been increasing more rapidly in winter than in any other season. This could mean lower heating bills for some people, but could also reduce the snowpack that supplies water to much of the West. See how seasonal temperatures are changing in your state. 

  • Shrinking Arctic Sea Ice

    Ice covering the Arctic Ocean sustains Alaskan Native communities, supports wildlife, and regulates the Earth's temperature by reflecting sunlight. Warming has caused this ice to shrink over the years, putting these vital benefits at risk. Explore the latest data. 

  • Indicator Infographics

    EPA has published five new infographics, which highlight key themes from EPA's indicator collection. These engaging visuals are shareable, downloadable, and printable. 

    Browse EPA's infographics

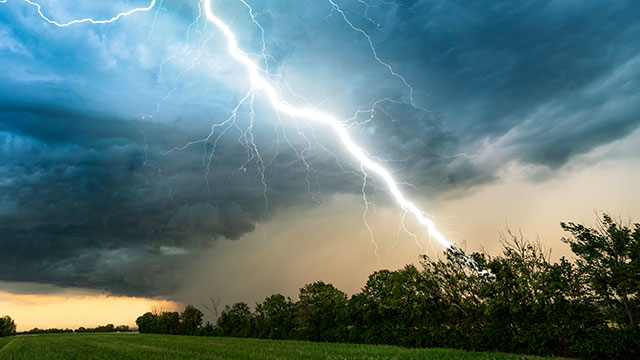
Temperatures are rising, snow and rainfall patterns are shifting, and more extreme climate events – like heavy rainstorms and record high temperatures – are becoming more common. Many of these observed climate changes are linked to rising levels of greenhouse gases in our atmosphere, caused by human activities. EPA’s indicators provide evidence of these changes and their impacts on people and the environment. EPA partners with dozens of data contributors to compile and keep these indicators up to date.

Visit Climate Change Indicators in the United States: Fifth Edition for a report that uses these indicators to show interconnections in how climate change affects people and the environment, why the impacts matter, and examples of how people and communities are addressing these challenges.
  • View the Indicators

    A placeholder image

    Check out more than 50 indicators that show the causes and effects of climate change.

    Start here
  • Dig into the Data

    Dig Into Data Card

    Explore the data with maps and figures.

    Explore interactive maps
  • Indicator Stories

    Indicators Stories Card

    Follow along with detailed narratives and supporting data about specific effects of climate change.

    Read the stories
  • About the Indicators

    About the Indicators Card

    Learn about how EPA develops indicators, find answers to frequent questions, and access publications.

    Learn about the effort
Featured Indicators
  • Background art from EPA’s 2024 report, with a drawing that provides an abstract representation of the edge of a glacier or ice sheet, with chunks of ice that have broken off and are floating in a rough ocean with waves. Words in the foreground say, “As the climate warms, water lost from melting glaciers and ice sheets ends up in the ocean, contributing to sea level rise.”

    Shrinking glaciers and rising seas.
    As Earth's temperatures rise, so do sea levels. Water lost from melting glaciers and ice sheets ends up in the oceans, directly contributing to rising sea levels. Warmer ocean temperatures also cause the water itself to expand. EPA’s Fifth Edition report compiles decades of data, highlighting the impacts of these changes on water supplies, ecosystems, and coastal communities.

  • Line graph with four lines showing the cumulative decrease in mass balance of four U.S. glaciers. Each line has annual data points. The lines start in the 1950s or 1960s, depending on the glacier, and extend until 2023. One glacier increased for a few years before declining overall. The other three have declined consistently.

    Glaciers losing ice.
    A warmer climate has caused glaciers in the United States and around the world to shrink as they lose ice more quickly than they can accumulate new snowfall. If glaciers disappear, this will pose a challenge for the communities and ecosystems that rely on them for streamflow and drinking water. See 70 years of data in the Glaciers indicator.

  • Line graph showing average global sea level with annual data points from 1880 to 2023. The graph shows a steady rise over time, with about a 10-inch increase from 1880 to 2023. The graph has one line for satellite data from 1993 to 2023, and another for results based on combining measurements from tide gauges along the world’s coast from 1880 to 2013. The two lines match and show a similar increase for the years where they overlap.

    Rising seas.
    In recent years, the ocean surface around the world has been rising by about an inch per decade. This is twice as fast as sea level rise during the last century. This rapid increase is closely tied to rising temperatures. Meltwater from glaciers and ice sheets flows into the ocean, while warmer ocean water expands, taking up more space. Together, these factors are driving sea level rise, which contributes to land loss, coastal flooding, and other risks. Dive into data from tide gauges and satellites with the Sea Level indicator.

  • Map showing the number of coastal flood days per year at locations along the U.S. coast. The map shows the contiguous 48 states with insets for Alaska, Hawaii, and Wake Island in the Pacific Ocean. A total of 42 locations are labeled on the map, At each location, a small graph shows columns that compare the number of flood days per year in 1950-1959 versus 2014-2023. At most locations, the more recent column is larger, indicating an increase in flood frequency.

    Coastal communities are flooding more frequently.
    As warmer temperatures cause sea level to rise, areas along U.S. coasts are flooding more often. In recent years, coastal communities have experienced more days of “nuisance” flooding at high tide, even on sunny days with no storm surge. Explore more than 60 years of flooding data at 42 sites along U.S coasts.

Related Resources

  • EPA Climate Change Homepage
  • EPA Climate Change Science
  • EPA Climate Change Research
  • U.S. Global Change Research Program Indicator Platform
Contact Us to ask a question, provide feedback, or report a problem.
Last updated on March 31, 2025
  • Assistance
  • Spanish
  • Arabic
  • Chinese (simplified)
  • Chinese (traditional)
  • French
  • Haitian Creole
  • Korean
  • Portuguese
  • Russian
  • Tagalog
  • Vietnamese
United States Environmental Protection Agency

Discover.

  • Accessibility Statement
  • Budget & Performance
  • Contracting
  • EPA www Web Snapshot
  • Grants
  • No FEAR Act Data
  • Plain Writing
  • Privacy
  • Privacy and Security Notice

Connect.

  • Data
  • Inspector General
  • Jobs
  • Newsroom
  • Regulations.gov
  • Subscribe
  • USA.gov
  • White House

Ask.

  • Contact EPA
  • EPA Disclaimers
  • Hotlines
  • FOIA Requests
  • Frequent Questions
  • Site Feedback

Follow.