
AltEn Facility, Mead, Nebraska - Fact Sheet, September 2021
Geospatial Measurement of Air Pollution, Field Screening
Introduction
In response to a request from the Nebraska Department of Environment and Energy (NDEE), the U.S. Environmental Protection Agency (EPA) Region 7 and Region 5 will be conducting an air monitoring survey of the closed AltEn ethanol facility near Mead, Nebraska. EPA will operate its Geospatial Measurement of Air Pollution (GMAP) air monitoring vehicle on public streets, following a path near and around the AltEn facility during the week of Sept. 13, 2021 (weather permitting). EPA will provide the collected data and mapping results to NDEE.
NDEE is the lead regulatory agency over the AltEn facility and has already conducted monitoring, including water, air, waste material, and soil sampling. The state has authorized several seed companies to develop a Remedial Action Plan under the NDEE Voluntary Cleanup Program.
Data collected from EPA’s GMAP unit during this assessment is intended to be used for air pollution screening purposes. The unit has capabilities for mobile and stationary emissions measurements, including source attribution.
Mobile Air Monitoring Overview
The GMAP unit is a mobile remote sensing unit (basically a truck) equipped with several air pollutant analyzers and technology that utilizes fast-response instruments and a global positioning system (GPS) to map air pollution around emission sources. The GMAP is designed to identify air pollution around sources of interest in communities to inform further steps. The air monitoring data can help identify airborne substances. Not all substances present at a given facility are detectable with air monitoring equipment, depending on the instrumentation. Sample results also can range from levels below detection and reporting limits to concentrations above levels of concern.
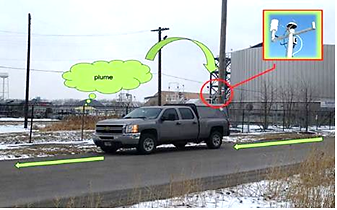
This system uses a mobile platform to measure specific chemicals in the atmosphere, including hydrogen sulfide (H2S), methane (CH4), benzene (C6H6), toluene (C7H8), p-xylene (C8H10), and sulfur dioxide (SO2). The GMAP platform also measures meteorological parameters (wind direction and speed) and GPS coordinates for each measured data point.
The GMAP mobile platform can be used to obtain highly sensitive ambient measurements to quantify air pollution concentrations, identify sources, and evaluate geospatial impacts of these specific chemicals.
This mobile platform allows EPA to identify pollutants in the air at the time of deployment to help discover potential sources. Using a mobile system gives EPA the capability to rapidly screen a large area where these potential sources may be located. This screening data is also helpful in informing future steps, including the potential need for additional monitoring.
Monitoring Facts
The GMAP’s combination of equipment allows for real-time screening and mapping of pollutants while the vehicle is in motion or taking stationary measurements at facilities or in the community.
The GMAP has two operating modes:
- Mapping (collection of data while driving continuously or mobile).
- Quantification (collection of data in a stationary position within a pollutant plume).
The unit’s capabilities also include:
- Employing next-generation mobile and stationary monitoring methods to assess fence-line and near-source concentrations of hydrogen sulfide, methane, benzene, toluene, p-xylene, and sulfur dioxide.
- Applying geospatial mapping to identify “fugitive” emission sources and community exposures.
- Measuring geographically dispersed sources and isolating processes within a facility.
GMAP requirements:
- Dry weather (no measurable precipitation).
- Minimum wind speed of 1 meter per second.
- Perimeter access to potential sources.
Mapping
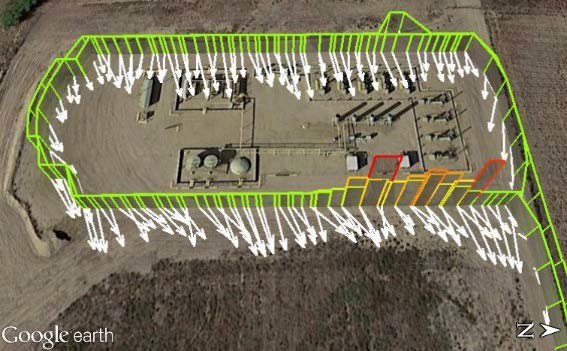
Figure 1 (at right) is an example of GMAP concentration “ribbon” results from mobile monitoring. This graphic shows the wind direction and speed depicted by the length and direction of the arrows. The measured concentrations are depicted by the area sections under the colored ribbon. The concentrations are overlaid on a map using the GPS data collected for each measurement.
Quantification – Polar Plots
EPA can use the stationary monitoring GMAP data together with the meteorological data (wind direction and speed) to generate additional concentration graphics, such as the bivariate polar plots in Figure 2 (below), to identify and better understand emission plumes. EPA can analyze the polar plots to isolate and attribute pollutant emissions to specific facilities.
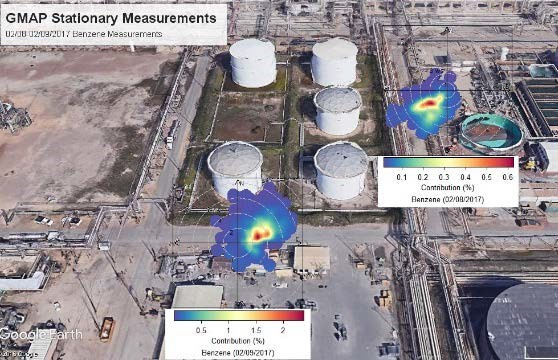
Bivariate polar plots use visual imagery to illustrate:
- The direction of air emissions from the source to the monitor.
- The amount (or relative concentration) of emissions from the source.
Additional Information
- Learn more about NDEE’s activities at this site.
- Read an overview of NDEE’s Voluntary Cleanup Program.
EPA Contact
Ben Washburn, Public Affairs – 910-795-5868, washburn.ben@epa.gov