
Exploring Environmental Health Data Using An Interactive Data Visualization Application
I’ve always loved working with data and helping people understand the relationships between data sets. That’s why I’m so excited about the app we’ve been developing that can help people get environmental and health indicators based on various relationships like income, location, and census data. It’s a new way to get important information to the fingertips of people like, community planners, regulators and the general public quickly and reliably every single time.
EPA has worked to develop relationships with many local and international partners over the years. The discussions, educational webinars, and information exchanges the partnerships produced have made this app possible.
About the Regional Environmental Health Data Visualization Application (REHD)
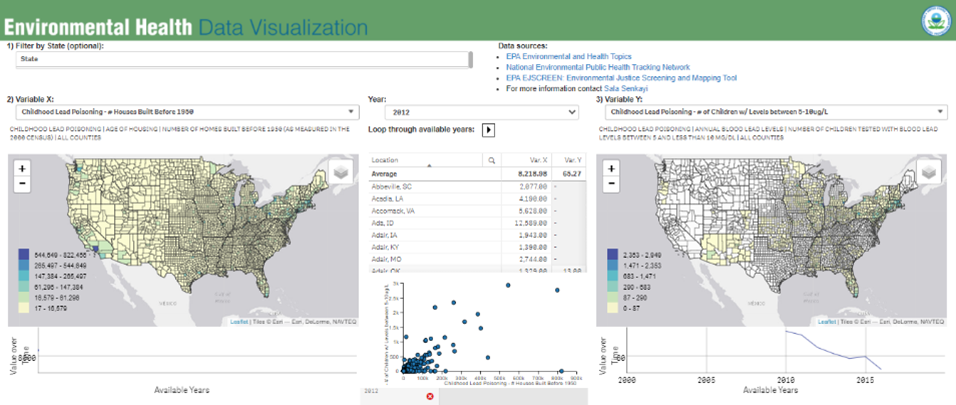
When I was working as the acting Regional Quality Assurance Manager in EPA’s Region 6, I was honored to get to work with EPA contractor Dr. Bryan Chastain to develop the Regional Environmental Health Data Visualization app (REHD). Dr. Chastain has developed numerous geospatial and data visualization-based applications for regions and program offices across the agency, additionally he’s received an international GIS award. This fascinating REHD tool visualizes health and environmental data provided by the Centers for Disease Control and Prevention (CDC) alongside other data. For example, the app can show counties with the highest number of homes built before 1950 alongside the highest number of children tested with elevated blood lead levels between 5 and 10 µg/dL.
Using Cherokee Nation Data to Explore Lead Paint Data
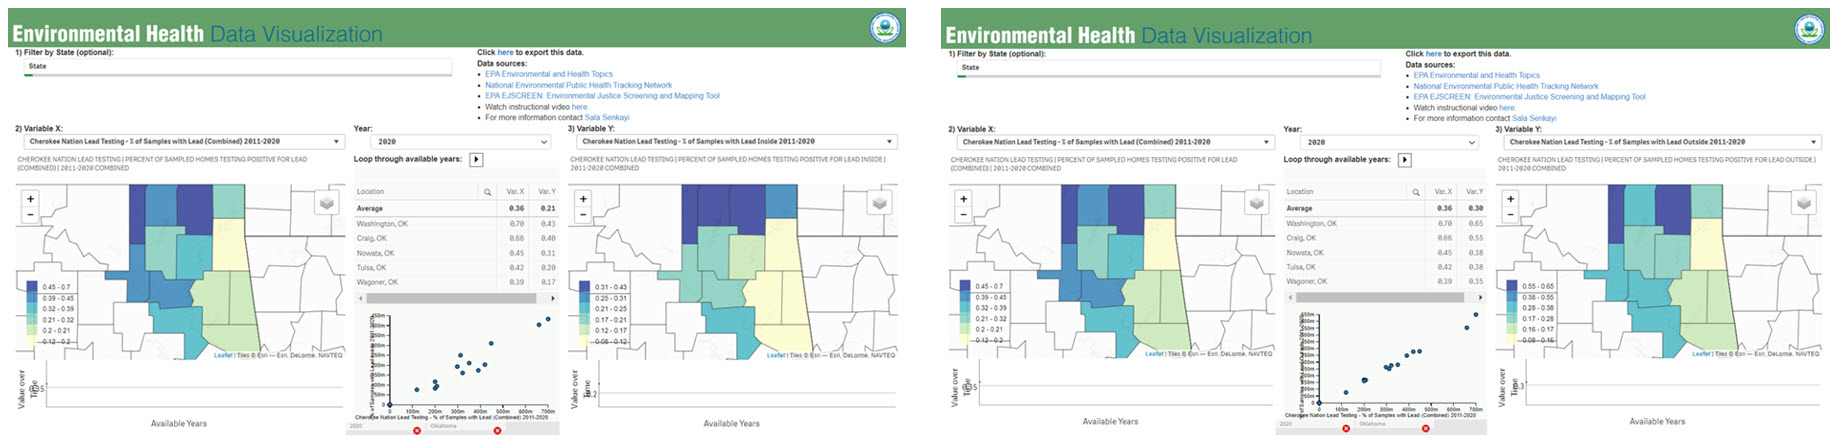
The Cherokee Nation provided its indoor and outdoor lead paint data (2011-2020) and worked with the app team to better understand environmental health relationships. Datasets were joined to create a combined layer within the app, as shown in the two images below. The lead paint data from the Cherokee Nation can also be visualized alongside other datasets within the app.
Identifying Relationships with Data
“Digital technological advances, like Dr. Senkayi’s visualization tools, can assist communities in learning more about relationships between health and the natural environment within their area.”
Dr. Brady Skaggs, Water Quality Program Director of Pontchartrain Conservancy and Ridgely P. Myers, P.E., Director of Operations of Pontchartrain Conservancy
Visualizing data in REHD helps identify data relationships. These visualization tools or apps help to visually display many years of information using more than just a static map, scatter plot or table. Displaying more than one dataset in REHD interactive apps provides a novel way of looking at environmental health information which can help identify communities potentially overburdened by pollution.
We are still working on the app and adding more datasets. Over time, the app will become more and more useful as we are able to add more data, compare results, and look for correlations. It’s an exciting time to be working with data at EPA!
- Explore the REHD app.
- Review the step-by-step how to guide on how to use the REHD app (pdf).

About the Author
Dr. Sala N. Senkayi
Senior Quality Assurance Scientist
EPA Region 7
Dr. Sala Nanyanzi Senkayi is the Senior Quality Assurance Scientist in EPA Region 7. During her time in EPA Region 6 she worked to find ways to visualize data in academia and at EPA. In 2017, she received the Presidential Early Career Award for Scientists and Engineers. Dr. Senkayi used these funds to develop the Regional Environmental Health Data Visualization tool/app while working alongside Dr. Bryan Chastain and also teaming up with others on visualizing their data within a series of apps.
Dr. Senkayi earned a bachelor’s degree in biomedical sciences from Texas A&M University, and earned bachelor’s degrees in microbiology and biology, and a master’s and a doctorate in environmental and Earth sciences from the University of Texas at Arlington. Her doctoral research findings on impacts of airport pollutant emissions, specifically benzene, on children’s health have been published in the Atmospheric Pollution Research Journal. Dr. Senkayi is an adjunct professor in Fort Worth, Texas. Teaching helps her keep abreast of emerging technologies and gives her the opportunity to encourages future generations to learn more about mapping tools.
Dr. Senkayi was honored to work alongside her dad (Dr. Abu L. Senkayi) in EPA Region 6 and enjoys family trips in her spare time.
Editor’s Note: The views expressed here are intended to explain EPA policy. They do not change anyone’s rights or obligations. You may share this article. However, please do not change the title or the content, or remove EPA’s identity as the author. If you do make substantive changes, please do not attribute the edited title or content to EPA or the author.
EPA’s official web site is www.epa.gov. Some links on this page may redirect users from the EPA website to specific content on a non-EPA, third-party site. In doing so, EPA is directing you only to the specific content referenced at the time of publication, not to any other content that may appear on the same webpage or elsewhere on the third-party site, or be added at a later date.
EPA is providing this link for informational purposes only. EPA cannot attest to the accuracy of non-EPA information provided by any third-party sites or any other linked site. EPA does not endorse any non-government websites, companies, internet applications or any policies or information expressed therein.