
Stream Nutrients Visualization Guide
The guidance below is designed to help visitors to understand how to use the various visualizations available on the EcoDIVER website. There are descriptive text and images for the various maps and plots available.
Geographic Maps
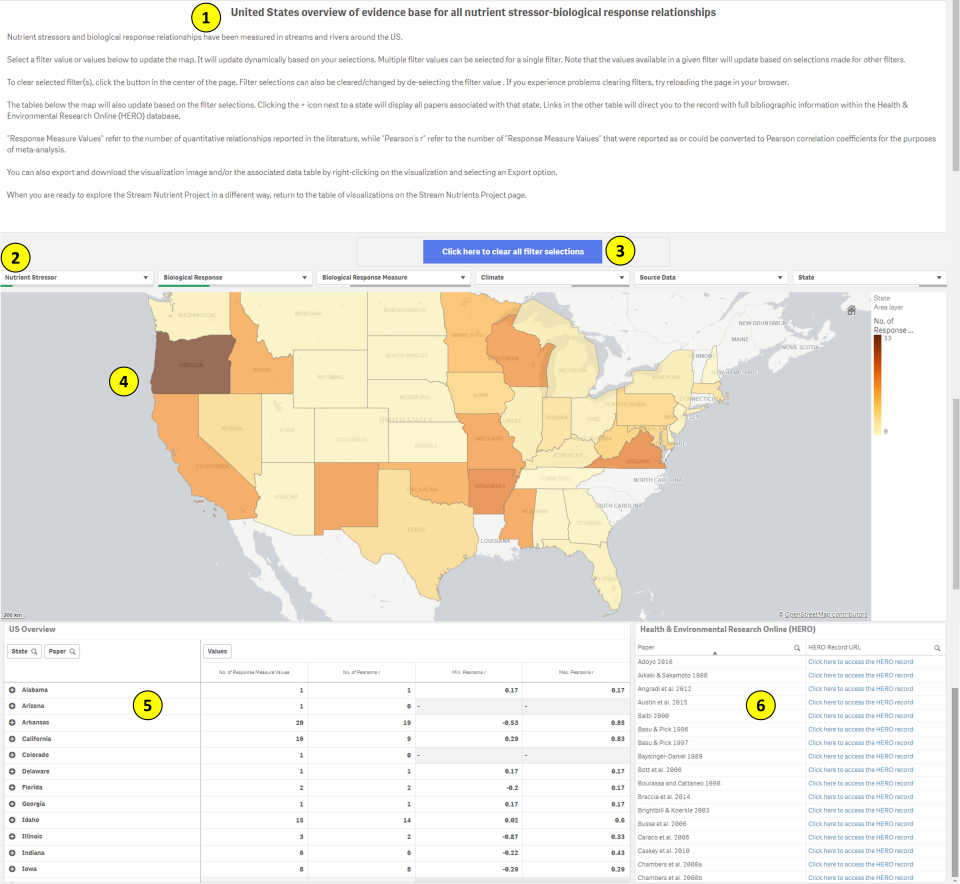
- Instructions. Refer to the instructions pane, located at the very top of the page, for text descriptions on how to interact with the map.
- Filters. Selectable dropdown boxes, located across the full width of the page directly above the map, can be used to display evidence subsets of interest to you.
- Clear filters. A "clear all filters" button, located just above the filters, can be used to clear all filter selections.
- Evidence map. A geographic map, located immediately below the filters, displays the amount of available evidence in a map format.
- Evidence table. An evidence table, located on the left side of the page below the map, displays the amount of available evidence in a tabular format, as well as the range of nutrient stressor-biological response relationship values. Click + next to the name of a country, region, or state to further break down evidence by citation.
- Citation table. A citation table, located on the right side of the page below the map, displays author-year for citations and links to more bibliographic information in the Health and Environmental Research Online (HERO) database.
Bar Chart and Distribution Plots
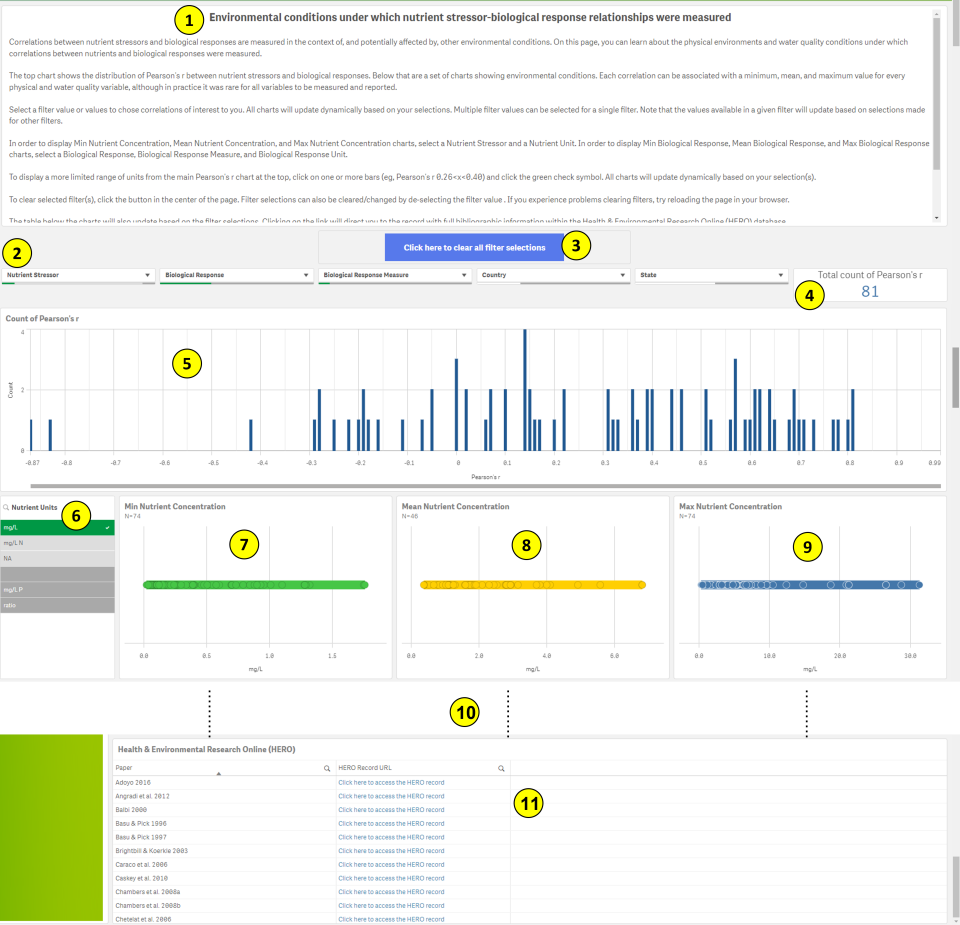
- Instructions. Refer to the instructions pane, located at the very top of the page, for text descriptions on how to interact with the bar chart and distribution plots.
- Filters. Selectable dropdown boxes, located across the full width of the page directly above the bar chart, can be used to display evidence subsets of interest to you.
- Clear filters. A "clear all filters" button, located just above the filters, can be used to clear all filter selections.
- Count of correlation coefficients. The number of Pearson’s r values that measure the relationship between selected nutrient stressor(s) and biological response(s) is displayed at the right side of the page, next to the filters.
- Chart of correlation coefficients. A bar chart, located just below the filters, displays the distribution of Pearson’s r values that measure the relationship between selected nutrient stressor(s) and biological response(s).
- Nutrient unit filter. The nutrient unit filter, located at the left side of the page just below the bar chart, can be used to select a measurement unit for the nutrient stressor and to display charts of minimum, mean, and maximum nutrient concentrations. A similar filter exists to select the measurement unit of the biological response.
- Minimum environmental condition.
- Mean environmental condition.
- Maximum environmental condition. Panels 7-9, located left to right just under the bar chart, display the distributions of the minimum, mean, or maximum environmental conditions (e.g., nutrient concentration, pH, water temperature) under which nutrient stressor-biological response relationships were measured. One value is displayed per Pearson’s r, if it was measured and reported. However, many times publications did not report associated environmental condition information. Therefore, the N= will always be ≤ the count in (4).
- Additional environmental conditions. Panels for additional environmental conditions, located directly below panels 7-9, display the minimum, mean, and maximum distributions of other environmental conditions.
- Citation table. A citation table, located just below the distribution plots for environmental conditions, displays author-year for citations and links to more bibliographic information in the Health and Environmental Research Online (HERO) database.
Heat Map
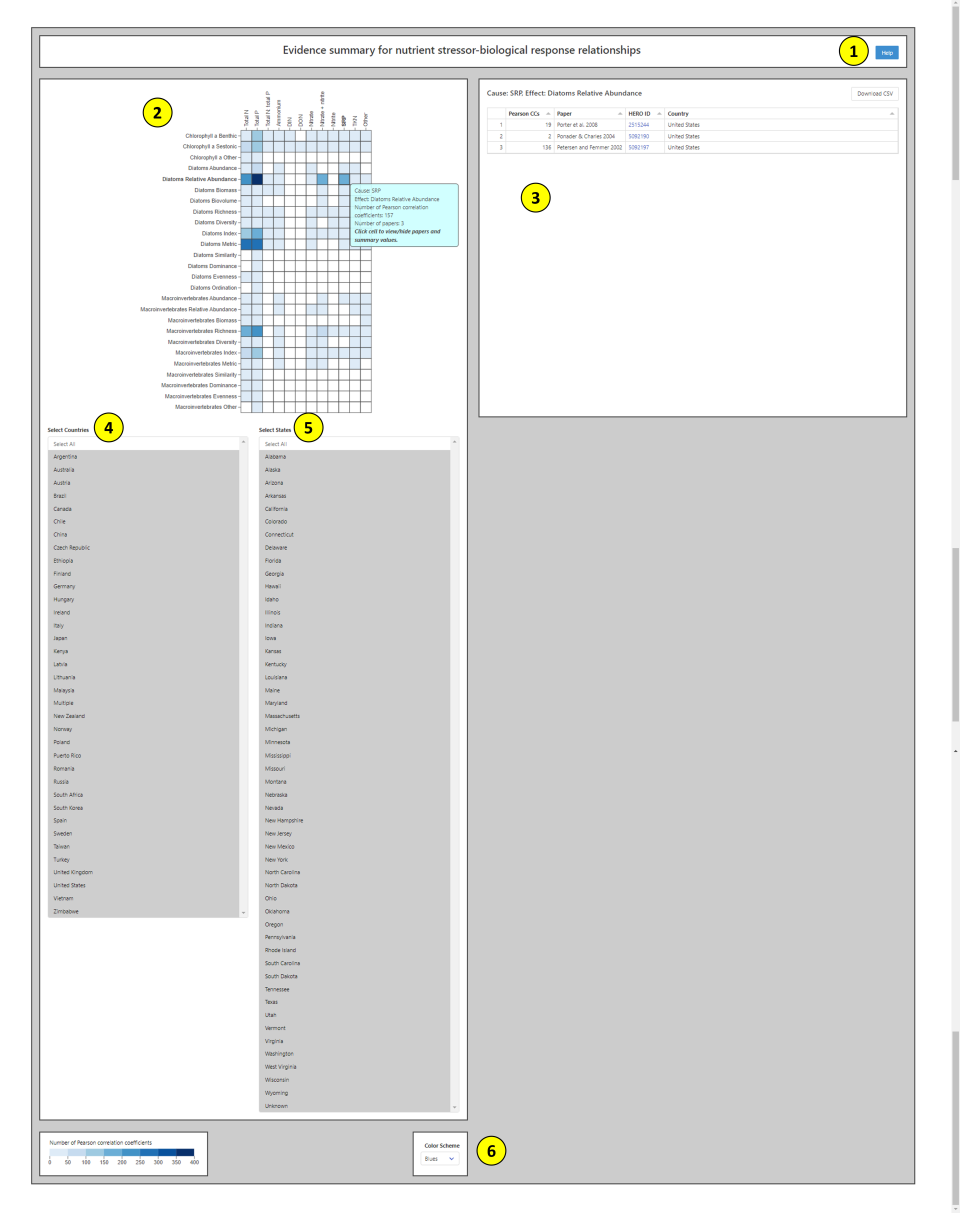
- Help. A help button, located at the top right of the page, provides help text for using the visualization.
- Evidence display. A heat map, located at the top left of the page, displays the amount of available evidence using intensity of color (see bottom left of page for legend explaining how shading relates to amount of evidence). Columns are nutrient stressors and rows are biological responses.
- Evidence and citation table. An evidence and citation table, located at the top right of the page, shows available evidence in a tabular format, based on the stressor-response relationship selected in the heat map. This table also includes author-year for citations and links to more bibliographic information in the Health and Environmental Research Online (HERO) database.
- Country filter. A country filter, located just below the heat map, can be used to select one or more countries to display evidence subsets of interest to you.
- State filter. A state filter, located to the right of the country filter, can be used to select one or more states to display evidence subsets of interest to you.
- Evidence display options. The selectable color scheme menu, located at the bottom middle of the page, can be used to select the heat map's color palette.
Modified Box Plots and Forest Plots
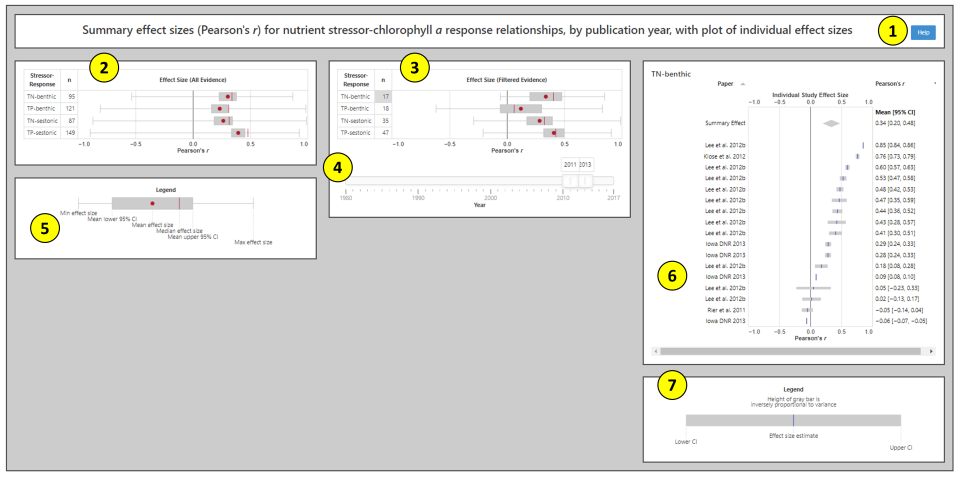
- Help. A help button, located at the top right of the page, provides help text for using the visualization.
- Summary effect size chart (all evidence). This summary effect size chart, located at the top left of the page, shows the central tendency, range, and sample size of Pearson’s r values for combinations of nutrient stressors and biological responses. This chart remains static to show all evidence from the project.
- Summary effect size chart (filtered evidence). This summary effect size chart, located in the middle of the page, shows the central tendency, range, and sample size of Pearson’s r values for combinations of nutrient stressors and biological responses. Change the chart by applying a filter (e.g., publication year or geographic location), located below the plot. Click on the sample size value for one of the nutrient stressor-biological response combinations, located on the left side of the plot, to view a forest plot of individual study effect sizes.
- Year filter. A filter located at the bottom of the plot can be used to select one or more publication years to display evidence subsets of interest to you. Other visualizations have country and state filters.
- Legend for summary effect size charts. The legend, located at the bottom left of the page, defines the features of the summary effect size charts.
- Forest plot. The forest plot, located at the top right of the page, shows individual study effect sizes of the nutrient stressor-biological response combination selected in (3). Change the order from top to bottom by clicking the triangles next to Paper and Pearson’s r at the top of the plot. A paper may have more than one effect size associated with it because the authors performed multiple analyses. Numeric values for the mean individual study effect size Pearson’s r and 95% confidence interval are on the far-right portion of the plot.
- Legend for forest plot. The legend, located at the bottom right of the page, defines the features of the forest plot.