
Smart Location Mapping
This page features interactive mapping tools and data for measuring location efficiency and the built environment.
- Background
- Smart Location Database
- Access to Jobs and Workers Via Transit Tool
- National Walkability Index
- Smart Location Calculator
- Suggested Uses
Background
A large body of research has demonstrated that land use and urban form can have a significant effect on transportation outcomes.
- People who live and/or work in compact neighborhoods with a walkable street grid and easy access to public transit, jobs, stores, and services are more likely to have several transportation options to meet their everyday needs.
- As a result, they can choose to drive less, which reduces their emissions of greenhouse gases and other pollutants compared to people who live and work in places that are not location efficient.
- Walking, biking, and taking public transit can also save people money and improve their health by encouraging physical activity.
An EPA-funded meta-analysis of the research, Travel and the Built Environment , summarized the measurable effects of several built environment variables on residents’ travel behavior. These findings can help inform travel demand studies as well as land use and transportation planning studies. However, developing data about these characteristics can be expensive and time consuming.
To respond to this need, EPA developed four data products that consistently measure the built environment and transit accessibility of neighborhoods across metropolitan regions and across the United States. Each product summarizes the characteristics of census block groups [i]. Users can download data, browse the data in interactive maps, or access the data through web services [ii].
- The Smart Location Database summarizes more than 90 different indicators associated with the built environment and location efficiency. Indicators include density of development, diversity of land use, street network design, and accessibility to destinations as well as various demographic and employment statistics. Most attributes are available for all U.S. block groups.
- The Access to Jobs and Workers Via Transit Tool provides indicators of accessibility to destinations by public transit. Indicators summarize jobs accessible by transit as well as workers, households, and population that can access the block group via transit. Coverage is limited to metropolitan regions served by transit agencies that share their service data.
- The National Walkability Index provides walkability scores based on a simple formula that ranks selected indicators from the Smart Location Database that have been demonstrated to affect the propensity of walk trips. Currently, the National Walkability Index dataset ranks each block group relative to all other block groups in the United States, but individuals can use downloadable data and the "how-to" document to construct an index for a smaller universe of block groups, like a state, metropolitan area, or city.
- The Smart Location Calculator is a dataset and interactive tool that measures the location efficiency of workplace locations. Developed by EPA and the General Services Administration (GSA), the interactive map allows users to explore the data, download the dataset, and access the accompanying documentation.
Smart Location Database
The Smart Location Database is a nationwide geographic data resource for measuring location efficiency. It includes more than 90 attributes summarizing characteristics, such as housing density, diversity of land use, neighborhood design, destination accessibility, transit service, employment and demographics. Most attributes are available for every census block group in the United States.
EPA first released a beta version of the Smart Location Database in 2011. The initial full version was released in 2013, and the database was updated to its current version in 2021.
Access the Data
- Interactive map viewer
- Download data for all areas with coverage (ZIP file)
- Metadata
- Web services
- Smart Location Database Technical Documentation and User Guide has a full description of all available variables, data sources, data currency, data coverage and known limitations.
Sample Variables Included in the Smart Location Database
Category | Variables |
|---|---|
Density | Gross residential density (housing units per acre) on unprotected land Gross population density (people per acre) on unprotected land Gross employment density (jobs per acre) on unprotected land |
Diversity of land use | Jobs per housing unit Employment entropy (a measure of employment diversity) Employment and housing entropy |
Urban design | Street intersections per square mile High-speed road network density |
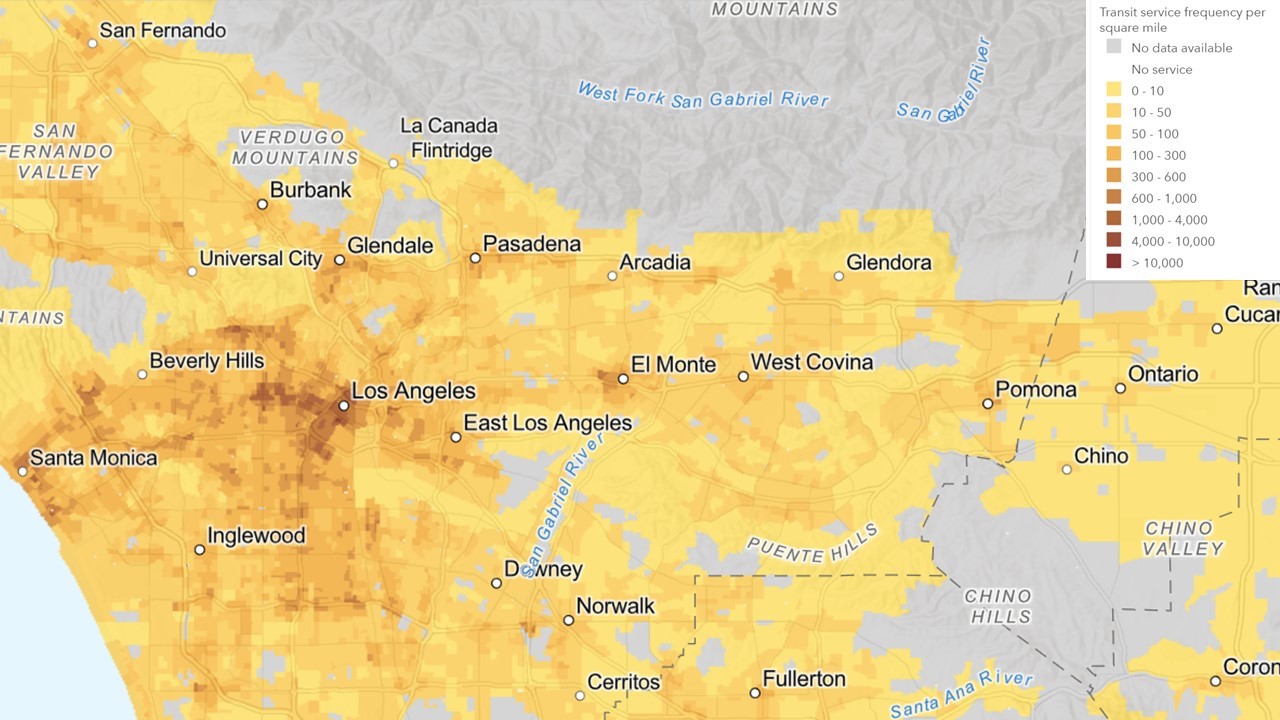
Transit service* | Aggregate transit service frequency, afternoon peak period Transit service density, afternoon peak period Distance to nearest transit stop |
Destination accessibility by transit* | Jobs within a 45-minute transit commute Working-age population within a 45-minute transit commute |
Destination accessibility by car | Jobs within a 45-minute drive Working-age population within a 45-minute drive |
Demographics | Percentage of households with no car, 1 car, or 2 or more cars Percentage of workers that are low, medium, or high wage (by home and work locations) |
Employment | Employment totals broken down by 5-tier classification scheme Employment totals broken down by 8-tier classification scheme |
*Only available in areas served by transit agencies that share transit data in GTFS format.
Access to Jobs and Workers Via Transit Tool
The Access to Jobs and Workers Via Transit tool is a free geospatial data resource and web mapping tool for comparing the accessibility of neighborhoods via public transit service. Its indicators summarize accessibility to jobs as well as accessibility by workers, households, and population.
Coverage is limited to metropolitan regions served by transit agencies that share their service data in a standard format called GTFS .
Access the Data
- Interactive map viewer
- Web Services
- Shapefile ZIP (253 MB)
- Dbf (ZIP) (8 MB)
- Esri Geodatabase (ZIP) (120 MB)
- Metadata
- Access to Jobs and Workers Via Transit - Technical Documentation and User Guide has a full description of data sources, data coverage (full list of metropolitan areas covered by GTFS) and other known limitations.
Sample Variables Included in This Dataset
| Map Layer Name | Description |
|---|---|
| Accessibility Index | An index of the relative accessibility of a block group compared to other block groups in the same metropolitan region, as measured by travel time to working-age population via transit. Values closer to 1 are more accessible. |
| Population with access by transit | Total population able to access the block group within a 45-minute transit and walking commute. |
| Percentage of population with access by transit | Total population able to access the block group within a 45-minute transit and walking commute as a percentage of total regional population. |
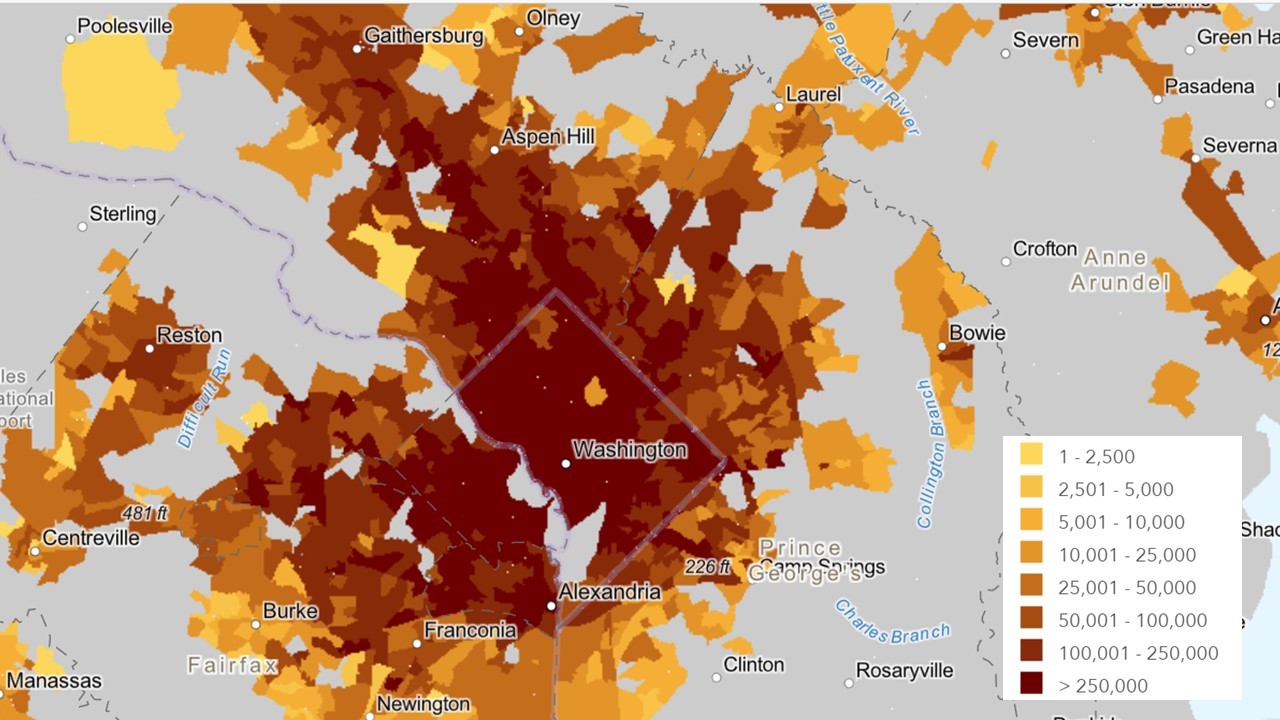
| Jobs accessible by transit | Total jobs reachable within a 45-minute transit and walking commute. |
| Percentage of regional jobs accessible by transit | Total jobs reachable within a 45-minute transit and walking commute as a percentage of total regional jobs. |
| Workers with access by transit | Employed population able to access the block group within a 45-minute transit commute from their home location. |
| Percentage of workers with access by transit | Employed population able to access the block group within a 45-minute transit commute from their home location as a percentage of total regional employed population. |
| Low-wage workers with access by transit | Workers earning $1,250 or less per month that can reach the block group within a 45-minute transit commute from their home location. |
| Percentage of all low-wage workers in region with access by transit | Low-wage workers that can reach the block group within a 45-minute transit commute from their home location as a percentage of all low-wage workers in region. |
| Low-medium wage workers with access by transit | Workers earning $3,333 or less per month that can reach the block group within a 45-minute transit commute from their home location. |
| Percentage of all low-medium wage workers in region with access by transit | Low-medium wage workers that can reach the block group within a 45-minute transit commute from their home location as a percentage of all low-medium wage workers in region. |
National Walkability Index
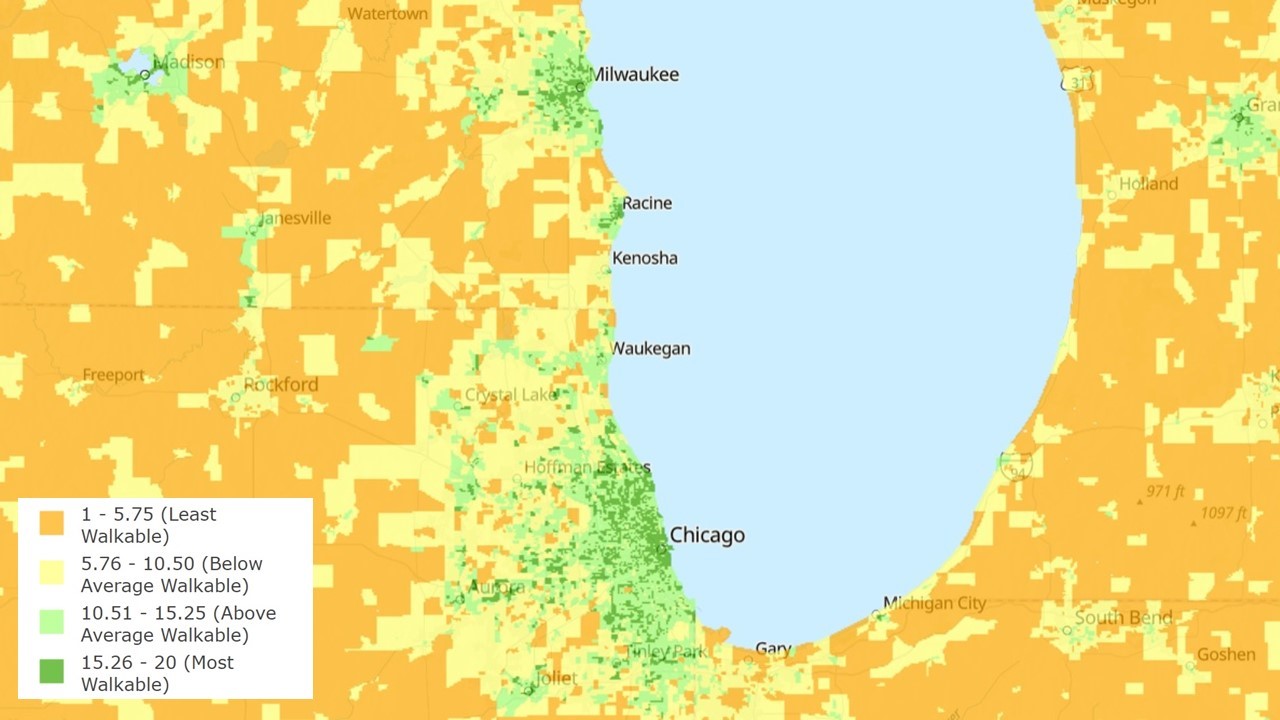
The National Walkability Index is a nationwide geographic data resource that ranks block groups according to their relative walkability. The national dataset includes walkability scores for all block groups as well as the underlying attributes that are used to rank the block groups.
Access the Data
- Interactive map viewer
- Download data for all areas with coverage (ZIP file)
- Metadata
- Web services
- National Walkability Index User Guide and Methodology describes how to use the index and the methodology used to derive the index and ranked scores for its inputs.
Sample Variables Included in This Dataset
| Dataset Field Name | Description |
|---|---|
| NatWalkInd | National Walkability Index score. Calculated by weighted formula using results of indicator rank scores. |
| D2A_EPHHM | The mix of employment types and occupied housing. A block group with a diverse set of employment types (such as office, retail, and service) plus a large quantity of occupied housing units will have a relatively high value. Higher values correlate with more walk trips. |
| D2B_E8MIXA | The mix of employment types in a block group (such as retail, office, or industrial). Higher values correlate with more walk trips. |
| D3b | Street intersection density (pedestrian-oriented intersections). Higher intersection density is correlated with more walk trips. |
| D4a | Predicted commute mode split - proportion of workers in the block group who carpool. |
| D2A_Ranked | Resulting rank of block group for D2A_EPHHM within all block groups. Range from 1-20, higher ranks indicate more walk trip likelihood. |
| D2B_Ranked | Resulting rank of block group for D2B_E8MIXA within all block groups. Range from 1-20, higher ranks indicate more walk trip likelihood. |
| D3B_Ranked | Resulting rank of block group for D3B within all block groups. Range from 1-20, higher ranks indicate more walk trip likelihood. |
| D4A_Ranked | Resulting rank of block group for D4A within all block groups. Range from 1-20, higher ranks indicate more walk trip likelihood. |
Smart Location Calculator
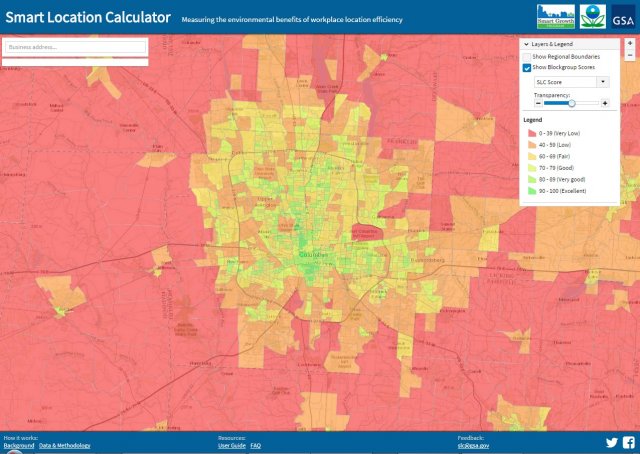
The Smart Location Calculator is a simple tool for exploring how workplace location affects worker commute travel. The tool provides location efficiency scores for a user-entered address, as well as location efficiency data summarized at the block group level. All of the scores are relative to the region. Other indicators include worker commute greenhouse gas emissions, mode share, vehicle miles traveled, and workplace accessibility via transit.
Only the Smart Location Index scores and related variables from the 2021 Smart Location Database version are available at this time. This page will be updated when data for other metrics, including transit accessibility and mode split, are available.
Access the Data
Sample Variables Included in This Dataset
| Dataset Field Name | Description |
|---|---|
| Score | Smart Location Index (SLI). Ranges in value from 0-100, where 0 indicates the least location-efficient site in the region, and 100 indicates the most location-efficient site. These scores are relative to the region and should not be compared across regions. |
| GHG | Commute greenhouse gas emissions per worker per year in pounds |
| GHG_av | Average GHG for the region (CBSA or county) |
Suggested Uses
- Assessing and comparing neighborhood conditions
Users can browse either dataset using a simple interactive map to assess and compare conditions across different neighborhoods in their communities. The Access to Jobs and Workers Via Transit tool includes regional benchmarks to compare the level of transit access of a neighborhood to the highest and average level of access for neighborhoods in the same metropolitan region. - Evaluating and prioritizing investments in location-efficient areasMuch like energy efficiency, location efficiency reduces resource demands while fostering a healthier, more sustainable built environment and providing equitable access to jobs and services. Location-efficient facilities or public-sector infrastructure investments are generally accessible via multiple transportation options, including:
- Public transit and active transportation.
- Centrally located in a region providing greater access and reduced travel distances.
- Integrated within a mixed-use environment that offers easy access to services and destinations.
- Scenario planning and travel demand modeling
Planners can use indicators from these datasets as baseline information for scenario planning, sketch planning, and travel demand studies when more detailed or consistent local data are unavailable. Analysts can also use elasticities found in the research literature to adjust outputs of travel or activity models that are otherwise insensitive to variation in the built environment. - Conducting nationwide research studies and developing tools
Researchers use the Smart Location Database and National Walkability Index to analyze the built environment and develop models, planning tools, and databases for use by public health researchers, planners, and elected officials who make decisions about land use and transportation policies, plans, and investments. Research on walkability highlights the relationship between the perception of how walking-friendly a given area is and the quality of life, as well as how walkability potentially influences physical activity.[iii] - Comparing urban form among metropolitan regions
Researchers can use these datasets in nationwide studies that compare metropolitan regions based on urban form characteristics. For instance, analysts could determine the percentage of residents that live in walkable or transit-rich neighborhoods. - Modeling impervious surface growth
EPA analyzed variables in a previous version of the Smart Location Database and the National Land Cover Database to create a model and simple spreadsheet tool for estimating new impervious surface growth associated with land use development scenarios. This model is sensitive not only to density of development but also to its relative centrality within the surrounding metropolitan region. For details, see EPA’s Impervious Surface Growth Model.
[i] Block groups are contained within census tracts and generally contain between 600 and 3,000 people, with an optimum size of 1,500 people. The land area of block groups varies based on population density.
[ii] Web services are widely used by geographic information system (GIS) professionals to share geospatial data. A web service is a representation of a GIS resource (spatial data) that a server makes available to other computers or applications. Smart Location Database web services provide access to data layers through ESRI's ArcGIS Server and Open Geospatial Consortium (OGC) service formats. Web services are used to display data in the Interactive Map Viewer table of contents and are also available for public use in desktop mapping applications or web-based mapping applications.
[iii] Jaśkiewicz, M., & Besta, T. (2014). Is Easy Access Related to Better Life? Walkability and Overlapping of Personal and Communal Identity as Predictors of Quality of Life . Applied research in quality of life, 9(3), 505–516.