
2022 EPA Employee Viewpoint Survey Summary
The U.S. Office of Personnel Management’s Employee Viewpoint Survey is an organizational climate survey administered to the federal workforce to provide agencies a snapshot of how their employees view their current work environment and help inform future agency actions. The Environmental Protection Agency views EVS results as crucial and ongoing input to our broad human capital planning processes, directly supporting the agency’s mission to protect human health and the environment.
Methodology
OPM administered the 2022 EVS to eligible EPA employees (all permanent and temporary employees onboarded as of November 2021) from May 30, 2022, through July 15, 2022. Of the 14,056 surveys administered, 7,757 were completed resulting in a 55.2% response rate.
Interpretation
OPM included four indices in 2022; three indices were carried over from previous survey years and one index was new. The agency sustained all-time high scores for the Employee Engagement (78%) and Global Satisfaction (74%) indices, the new Diversity, Equity, Inclusion and Accessibility Index scored well (77%), and there was a slight decrease (1%) for the Performance Confidence Index from the previous year. The table below shows the EVS index results for 2022.
2022 EVS Index Percentage Positive Responses
| Index Type | Percentage | Comparison to 2021 Results |
|---|---|---|
| Employee Engagement Index | 78% | Sustained |
| Global Satisfaction Index | 74% | Sustained |
| Diversity, Equality, Inclusion and Accessibility Index | 77% | New index for 2022 |
| Performance Confidence Index | 90% | Decrease of 1% |
The Employee Engagement Index is a measure of workforce conditions supporting engagement. The index comprises 15 items grouped into three subindices: Leaders Lead, Supervisors and Intrinsic Work Experience.
The Global Satisfaction Index is a combination of four items assessing employees’ satisfaction with their job, pay and organization, plus their willingness to recommend their organization as a good place to work.
The new Diversity, Equity, Inclusion and Accessibility Index is a measure of agency practices related to DEIA, combining 13 items introduced in 2022. Though the individual items have appeared in previous surveys as pilot questions, 2022 was the first year OPM reported them as an index score to EPA.
The Performance Confidence Index is a combination of five items assessing employees’ perception of their work unit’s ability to achieve goals and produce work at a high level. Though the individual items have appeared in previous surveys, 2021 was the first year OPM reported them as an index score to EPA.
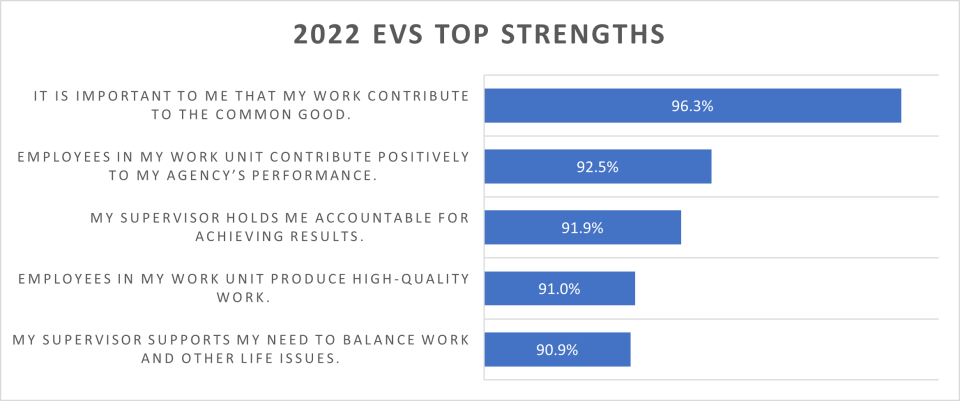
2022 Strengths
OPM defines strengths as those EVS items with a positive response score of 65% or higher (Strongly Agree and Agree on a 5-point Likert scale). EPA results identified 73 strengths for this year’s EVS. The top five strengths are shown below:
- It is important to me that my work contribute to the common good. (96.3%)
- Employees in my work unit contribute positively to my Agency’s performance. (92.5%)
- My supervisor holds me accountable for achieving results. (91.9%)
- Employees in my work unit produce high-quality work. (91.0%)
- My supervisor supports my need to balance work and other life issues. (90.9%)
2022 Increases
The items with the largest increases (3.0% or more) in positive responses (Strongly Agree and Agree on a 5-point Likert scale) from 2021 to 2022 include:
| EVS Item | 2022 Positive Score | Change from 2021 |
|---|---|---|
| I can disclose a suspected violation of any law, rule or regulation without fear of reprisal. | 75.3% | +4.3% |
2022 Decreases
Positive responses decreased for 18 EVS items, with four items declining by 3.0% or more (shown in the table below). The remaining 14 items experienced less than a 3.0% decline.
| EVS Item | 2022 Positive Score | Change from 2021 |
|---|---|---|
| In my work unit, differences in performance are recognized in a meaningful way. | 48.3% | -8.5% |
| Employees are protected from health and safety hazards on the job. | 80.4% | -4.8% |
| How satisfied are you with your involvement in decisions that affect your work? | 58.9% | -4.4% |
| Considering everything, how satisfied are you with your pay? | 67.5% | -3.7% |
2022 Challenges
“Continually changing work priorities make it hard for me to produce high quality work.” represented the only challenge question (35% or higher negative response) for EPA.
EPA-Specific Items
EPA has included eight agency-specific items in the EVS since 2016. The following table shows the agency-specific items, their respective positive scores (Strongly Agree and Agree on a 5-point Likert scale) for 2022, and the percentage point change from 2021.
| Agency-Specific EVS Items | 2022 Positive Score | Change from 2021 |
|---|---|---|
| Managers in my office make effectively managing their people a priority. | 64.5% | -2.1% |
| My office's top-level management team is aware of the challenges that can affect my work. | 56.3% | -1.6% |
| In my organization, employee feedback is incorporated into supervisor's annual performance reviews. | 36.9% | -0.5% |
| Senior leaders in my organization actively work to eliminate barriers to productivity that I face in my daily job. | 42.5% | -1.6% |
| In our work culture, people feel free to raise dissenting opinions without it having a negative impact on their careers. | 56.4% | +2.1% |
| My office's processes have a negative impact on my work output. | 27.8% | +0.4% |
| I have access to the technology I need to do my job effectively. | 78.3% | +0.4% |
| My supervisor supports my career planning and advancement. | 77.1% | -0.4% |
Pandemic Items
Pandemic items in 2022 measured leadership support for safety and health, participation in remote and telework schedules, retention; and fairness of re-entry arrangements. All percentages are positive (Strongly Agree and Agree on a 5-point Likert scale).
Leadership Support
- 92% of survey participants say their supervisor supports their efforts to stay healthy and safe while working (Q98); 90% say their supervisor creates an environment where they can voice concerns about staying healthy and safe (Q99).
- 80% of survey participants say their organization’s senior leaders support policies and procedures to protect employee health and safety (Q96); 79% say their organization’s senior leaders provide effective communication about what to expect with the return to the physical worksite (Q97).
Remote and Telework Schedules
- 13% of survey participants have an approved remote work agreement, and 57% telework three or more days a week (Q91).
- The pandemic influenced an increase in remote work. 73% of those who currently have a remote work agreement did not have an approved remote work agreement before the pandemic (Q92).
Retention (Q93)
- Based on their work unit’s current telework or remote work options, 83% are not planning to leave the Agency.
- Among the others who are planning to leave, the reasons (in descending order), would be for retirement (5%), taking another job within the Federal government (5%), taking another job within the Agency (2%), taking a job outside of the Federal government (2%) and other unnamed reasons (2%).
Fairness (Q94)
- 68% perceive the Agency’s re-entry arrangements as fair in accounting for employees’ diverse needs and situations.