National Wetlands Condition Assessment 2021 Key Findings
National Wetland Condition Assessment: The Third Collaborative Survey of Wetlands in the United States
Key Findings
The National Wetland Condition Assessment: The Third Collaborative Survey of Wetlands in the United States presents the results of the 2021 survey of wetland condition in the conterminous United States.
The NWCA is one of four statistical surveys in the National Aquatic Resource Surveys (NARS) program, which is designed to assess the condition of all waters nationally over time. For more information, see the NARS history page.
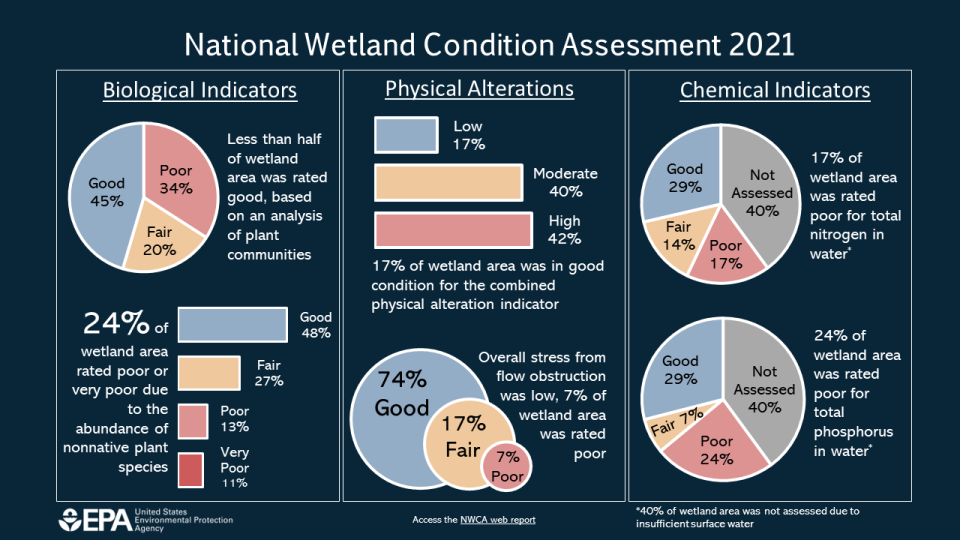
Less than half of wetland area was rated good, based on an analysis of plant communities.
- The EPA calculated a vegetation indicator score by combining several metrics based on abundance and types of plant species into one value.
- The EPA found 45% of wetland area was in good condition.
Nonnative plants are a widespread concern.
- Using an indicator based on the occurrence and abundance of nonnative plants, EPA found less than half of wetland area, 48%, was rated as being in good condition, and 24% was rated poor or very poor.
Physical alterations to wetlands are the most widespread stressors measured. The NWCA reports on six indicators of physical alteration, based on evidence of certain human activities observed at each sampling site. These alterations directly affect vegetation, hydrology (water levels and the flow of water), or soil. The NWCA also measures the presence of multiple categories of alterations at each site by combining the results of the six indicators.
- The combined indicator showed that 82% of wetlands were in fair or poor condition.
- Indicators for both vegetation replacement (e.g., replacement of native vegetation with pasture or croplands) and vegetation removal (e.g., clearing, excessive grazing by livestock) showed 56% of wetland area in fair or poor condition.
- The indicator for soil hardening (e.g., soil compaction or hardened surfaces such as roads), showed fair or poor condition for 49% of wetland area.
Nutrient levels are elevated for some wetlands.
- Nitrogen and phosphorus levels were measured at wetland sites where enough surface water was present to collect a water sample. Nitrogen and phosphorus conditions were found to be poor at 17% and 24% of wetland area, respectively. However, because many wetlands did not have surface water, 40% of wetland area could not be assessed for water chemistry.
- In wetlands where phosphorus and nitrogen were elevated, biological condition expressed by the nonnative plant indicator, was 1.6 and 1.7 times more likely, respectively, to be rated poor or very poor.
Microcystins, a type of cyanobacteria toxin, were present, but at very low levels, posing minimal recreational human health concerns.
- Microcystins were detected in 30% but exceeded the EPA’s recommended water quality criteria in less than 1% of wetland area. However, because many wetlands did not have surface water, 40% of wetland area could not be assessed for microcystins.
KEY FINDINGS ON CHANGE FROM 2016 TO 2021
For biological indicators (vegetation and nonnative plants), there was little change between surveys at the national level.
There were significant changes in some chemical and human health measures in 2021.
- Wetland area in good condition for nitrogen levels increased 8 percentage points, to 29%.
- Detection of microcystins increased by almost 22 percentage points, to 30%, but the small percentage of wetland area with concentrations that exceeded human health risk benchmarks (<1%) did not change significantly.