
Regional Monitoring Networks Tools
Background
During the RMN site selection process, a screening procedure is performed to identify locations along a standardized disturbance gradient for monitoring. In many regions, participants target many minimally disturbed or ‘reference’ systems to consider as a baseline. Locations of concern or interest are compared with reference sites, which means good quality data are needed for the reference site(s) consistently over time. If the aquatic communities in the reference locations change, the RMN will need to characterize how, and if possible why, the community shifted. Multiple reference sites within an RMN will help programs detect and assess shifting baselines.
Also, the natural physical attributes of each sampling site (such as drainage area, slope, and sinuosity) are described for classification purposes. Attempts are made to use GIS data that are available nationwide and that are derived using common data sources and methods.
Tools for GIS-based site screening
Currently, the stream RMNs use several ArcMap tools developed by EPA. These tools are described in the USEPA (2017) report “Procedures for Delineating and Characterizing Watersheds for Stream and River Monitoring Programs.” The ArcMap tools generate the following types of data (based on exact watershed delineations):
- Proportions of each National Land Cover Database (NLCD) land cover category at three spatial scales: whole watershed, within 1- and within 5-km radii of the sampling stations
- Baseflow index at the sampling station
- Channel slope and sinuosity at each station
- The slope of the watershed (average, minimum, maximum, range, standard deviation) relative to the sampling location
- The number of dams, mines, National Pollutant Discharge Elimination System (NPDES) and Comprehensive Environmental Response, Compensation, and Liability Act (CERCLA) sites within each watershed
The product is a watershed delineation shapefile that has fields with all the watershed properties listed above. The report and ArcMap tools can be found on Procedures For Delineating And Characterizing Watersheds For Stream And River Monitoring Programs (Final Report) page.
In addition, EPA uses stream catchment (StreamCat) data (Hill et al. 2016), the Index of Watershed (IWI), and the Index of Catchment Integrity (ICI) (Thornbrugh et al. 2018). The StreamCat data set contains hundreds of metrics, both anthropogenic (e.g., urbanization, agriculture, and mines) and natural (e.g., soils, geology, climate, and land cover). The IWI and ICI are overall indices of watershed integrity based on multiple measures. They are all based on the free National Hydrography Dataset Plus version 2.1 (NHDPlusV2) geospatial data set (McKay et al. 2012)
For the lake RMNs, natural and anthropogenic data from the Lake-Catchment (LakeCat) dataset (Hill et al. 2018) are being used. LakeCat is a nationally consistent data set that currently has 136 natural and anthropogenic geospatial metrics for lakes within the conterminous United States. The data are also based on the free NHDPlusV2 geospatial dataset (McKay et al. 2012)
Other metrics may be added as new geospatial layers that are relevant to lake conditions become available.
Site screening methods are under development for wetlands RMNs.
Tools for continuous sensor data
Most stream RMN sites collect year-round temperature and hydrological data at 30-minute intervals or less with continuous sensors. At lake RMN sites, where feasible, partners are deploying moored arrays of continuous sensors that record temperature, dissolved oxygen and water level data year-round at 60-minute intervals or less.
These high frequency measurements capture temporal patterns and episodic events that might otherwise be missed with limited discrete measurements (Figure 1). Continuous data, however, also can pose a challenge. Specifically, the amount of data collected can be overwhelming, especially for RMN partners who might lack data management systems capable of accommodating the volume of continuous data. To help RMN partners manage the data, EPA and partners developed tools and training materials to make quality assurance and quality control (QA/QC), summarizing, visualizing, and managing continuous data easier, including the ContDataQC RShiny App or ContDataQC R package. The RShiny App is accessible through a browser, while the R package requires R software to be installed. Detailed documentation with installation instructions, example codes, and test data can be found on the ContDataQC GitHub page.
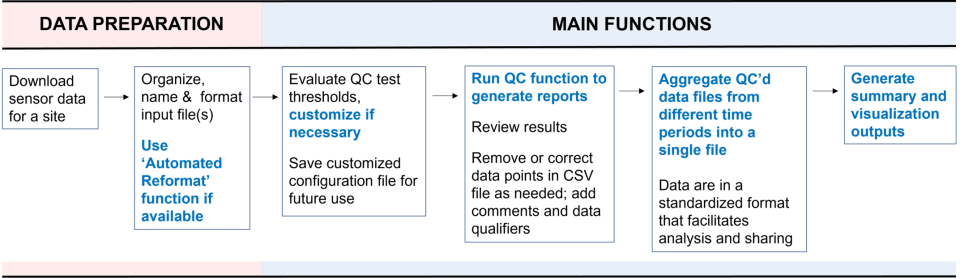
The ContDataQC RShiny App (or R package) has three main functions: generate QC reports (called ‘QC raw data’ in the R Shiny app and ‘QCRaw’ in the R package), merge QC’d data files from different time periods (called ‘Aggregate QC’d data’ in Shiny and ‘Aggregate’ in the package) and generate time series plots and basic summary statistics (called ‘Run summary statistics’ in Shiny and ‘SummaryStats’ in the package).
Main functions (which need to be run sequentially) include:
- ‘QC raw data’, which generates QC reports that include results from four ‘flag’ tests, missing data reports, and time series plots.
- ‘Aggregate QC’d data’, which combines QC’d data files from different time periods into a single file. Columns with matching names are merged. Columns with non-matching names are carried through as standalone columns.
- ‘Run summary statistics’ generates two sets of comma-delimited (CSV) spreadsheets (one with daily means and the other with a wider range of summary statistics - e.g., minimum, median, maximum, quartiles) and a PDF with time series plots for each parameter.
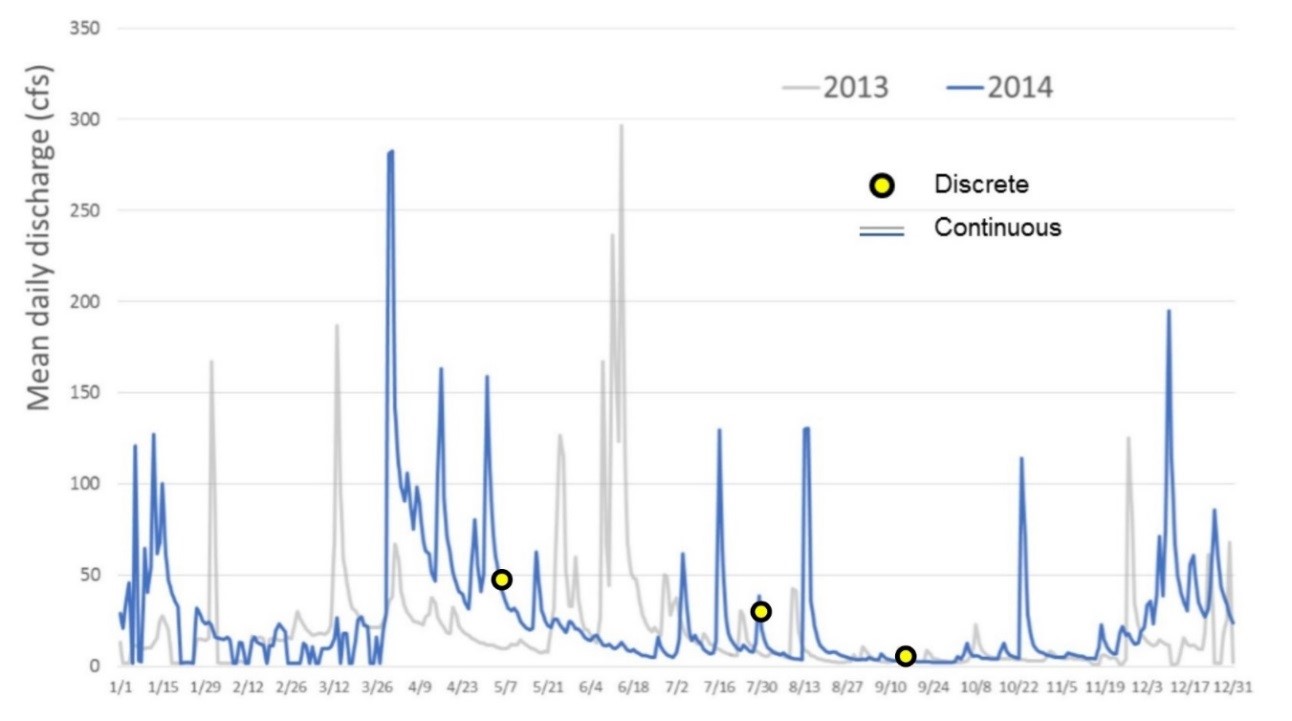
Figure 2 shows the general workflow that users follow when using the ContDataQC R tools. Instructional materials are available on the Shiny app website and GitHub.
Tools for image processing
A number of RMN sites use time-lapse cameras to capture images of stream flow or water levels in lakes. Site information and images are uploaded to the Flow Photo Explorer web application hosted by the U.S. Geological Survey (USGS). EPA Regions 1, 2, 3, and 5, USEPA Office of Research and Development, and the U.S. Geological Survey (USGS) are collaborating to further develop the Flow Photo Explorer . The collaboration is developing algorithms to estimate water level and discharge based on the images provided by state, tribal, and EPA regional partners. This innovative method makes it easier to calculate stream flow in small streams and remote locations that are not otherwise gauged. Lake and wetland images also will be analyzed to produce a continuous record of water levels and other parameters.
Tools for biological data
At stream RMN sites, at a minimum, macroinvertebrates are collected. Collection of fish and periphyton are encouraged but optional. Macroinvertebrates are targeted because they are the most commonly-used animal assemblages in stream bioassessments. They make good indicators for several reasons:
- they respond to a wide range of stressors;
- many (not all) taxa are easily and consistently identified;
- taxa have limited mobility, short life cycles, and are evolutionarily diverse; and
- traits (e.g., thermal preferance) can be linked to environmental conditions.
EPA is currently supporting the development of R tools to help RMN partners prepare and analyze the biological data collected at RMN sites. One tool for biological data is the BioMonTools R package, which currently performs the functions in Table 1 that are marked with ‘X'.
For lakes, biological data are also of high importance but are considered a longer-term pursuit. For many programs, biological protocols for lakes are still in a formative stage, and more work is needed to achieve consensus on which are most suitable for this regional effort. Lake RMN partners are planning to use the RMNs as a forum for advancing methods. Potential assemblages include sediment diatoms, fish, macroinvertebrates, macrophytes, zooplankton, phytoplankton and soft-bodied algae from the water column.
Other Tools
Other tools applicable to RMNs include: