
Exceptional Events Analysis and Visualization Tools
The following tools can help with data screening and determining regulatory significance in support of exceptional events demonstration submissions.
Expedited Modeling of Burn Events Results (EMBER)
- EMBER Dataset Tool
This tool displays ozone monitoring days that may have been impacted by fire emissions for 2021-2025.
HYSPLIT for Exceptional Events
- HYSPLIT for Exceptional Events Tool
This tool provides users with quick access to trajectories, smoke plumes, and fire locations for 2023-2025.
Identify days potentially impacted by exceptional events
Multi-year Tile Plot
Plots daily AQI values across multiple years. Each tile represents one day of the year and is color-coded based on the highest daily AQI value, helping identify days potentially impacted by exceptional events.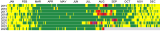
Single-year Tile Plot
Plots daily AQI values for a single year. Each tile represents one day of the year and is color-coded based on the highest daily AQI value, helping identify days potentially impacted by exceptional events.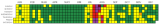
Concentration Map
Maps daily concentrations over several days which can help identify areas potentially impacted by exceptional events.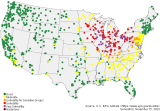
- AirNowTech Navigator (requires account on AirNowTech)
AirNowTech is a password-protected website for air quality data management, analysis, and decision support. It allows users to:- Access monitoring site data, information, and polling status
- Analyze current and past air quality events and episodes
- Submit and analyze air quality forecasts
Assess potential regulatory significance
- Exceptional Events Design Value Tool
This tool allows state, local, and tribal air monitoring agencies to determine the regulatory significance (i.e. whether excluding concentrations affected by exceptional events will affect attainment of the NAAQS) of ozone and PM2.5 concentrations impacted by exceptional events by calculating the impact of excluding these concentrations on the design value, the statistic used to determine whether an ambient air quality monitoring site is meeting the NAAQS. - Air Quality Statistics Report
Determine exceptional event tier category for your site(s)
- PM2.5 Tiering Tool
This tool displays daily PM2.5 concentrations, along with tier levels based on the methodology described in the PM2.5 Wildland Fire Exceptional Events Tiering Document.
Here are additional online resources and tools related to exceptional events data analysis.