U.S. flag

An official website of the United States government

Here’s how you know

Dot gov

Official websites use .gov
A .gov website belongs to an official government organization in the United States.

HTTPS

Secure .gov websites use HTTPS
A lock (LockA locked padlock) or https:// means you’ve safely connected to the .gov website. Share sensitive information only on official, secure websites.

    • Environmental Topics
    • Air
    • Bed Bugs
    • Chemicals and Toxics
    • Climate Change
    • Emergency Response
    • Environmental Information by Location
    • Environmental Justice
    • Greener Living
    • Health
    • Land, Waste, and Cleanup
    • Lead
    • Mold
    • Pesticides
    • Radon
    • Science Topics
    • Water Topics
    • A-Z Topic Index
    • Laws & Regulations
    • By Business Sector
    • By Topic
    • Compliance
    • Enforcement
    • Guidance
    • Laws and Executive Orders
    • Regulations
    • Report a Violation
    • Environmental Violations
    • Fraud, Waste or Abuse
    • About EPA
    • Our Mission and What We Do
    • EPA Administrator
    • Headquarters Offices
    • Regional Offices
    • Labs and Research Centers
    • Planning, Budget, and Results
    • Organization Chart
    • EPA History
    • Staff Directory
Benefits Mapping and Analysis Program (BenMAP)
Contact Us

How BenMAP-CE Estimates the Health and Economic Effects of Air Pollution

What are the health impacts associated with poor air quality?

The BenMAP-CE tool estimates the number and economic value of heath impacts resulting from changes in air quality - specifically, ground-level ozone and fine particles. Before describing how BenMAP-CE calculates impacts and economic values, it is helpful to first understand how air pollution affects health.

Air pollution can cause adverse health outcomes that include premature death, hospital admissions, aggravated asthma and cause you to miss school and work.

Fine particles can enter deep into the lungs and enter the blood stream. Health impacts from particles include:

  • Premature death
  • Non-fatal heart attacks
  • Aggravated asthma

Ground-level ozone is an oxidant that can irritate airways in the lungs. Health impacts form ozone include:

  • Premature death
  • Aggravated asthma
  • Lost days of school

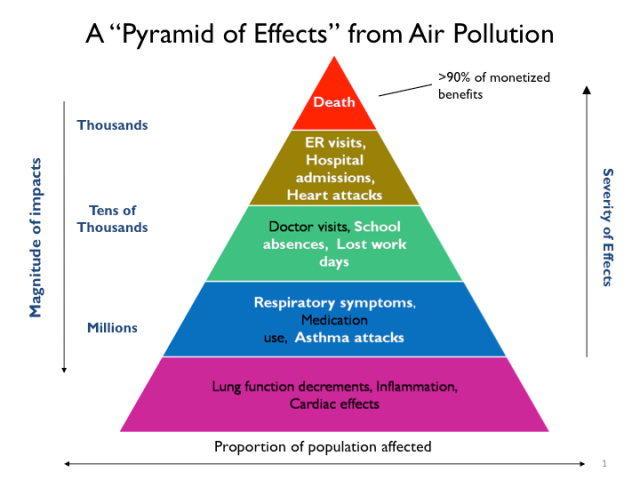
The pyramid above describes how the incidence, and severity, of fine particle and ozone-related health impacts are related. Health outcomes toward the bottom of the pyramid like asthma attacks and cardiac effects are less severe, and affect a large​r proportion of the population. Impacts toward the tip of the pyramid like hospital admissions and heart attacks are more severe and affect a smaller proportion of the population. BenMAP-CE quantifies those impacts shown in white.

How does BenMAP-CE estimate health impacts?

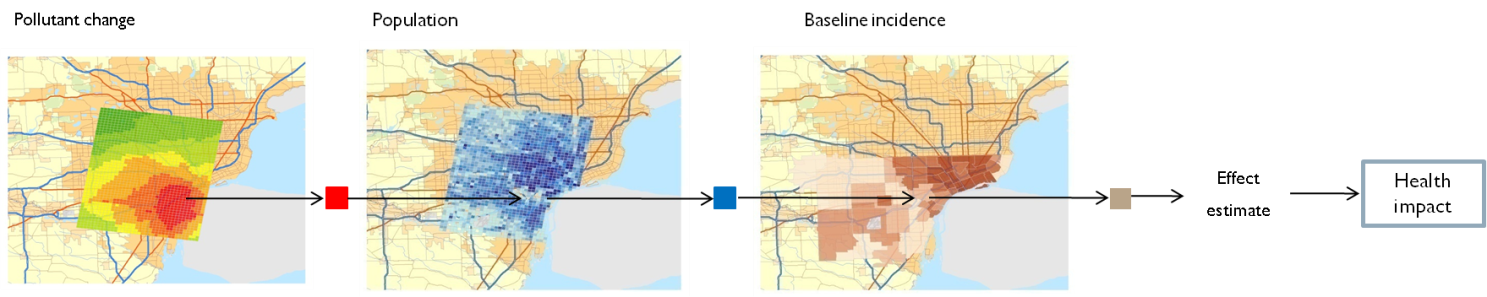
A health impact function incorporates four key sources of data: BenMAP-CE uses "health impact functions" that are constructed using information from the published epidemiology literature.

  1. modeled or monitored air quality changes;
  2. population;
  3. baseline incidence rates;
  4. an effect estimate.

The figure below describes the data BenMAP-CE uses to calculate health impacts.

The BenMAP-CE program calculates health impacts using air pollution estimates, population data, baseline incidence rates and an effect estimate.
 

How does BenMAP-CE calculate economic values? 

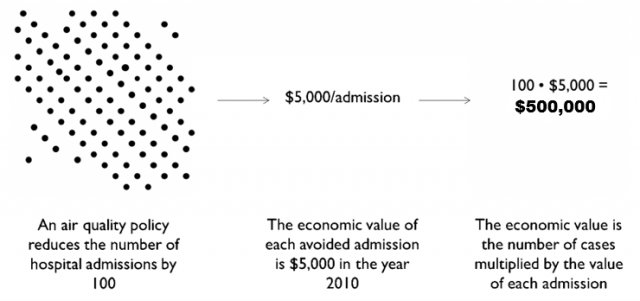
The program calculates the economic value of air quality change using both “Cost of Illness” and “Willingness to Pay” metrics. The Cost of Illness metric summarizes the expenses that an individual must bear for air pollution-related hospital admissions, visits to the emergency department and other outcomes; this metric includes the value of medical expenses and lost work, but not the value that individuals place on pain and suffering associated with the event. By contrast, Willingness to Pay metrics are understood to account for the direct costs noted above as well as the value that individuals place on pain and suffering, loss of satisfaction and leisure time.

This simple example summarizes the procedure for calculating economic values using these two metrics in BenMAP-CE. Find out more about the assumptions at Applications: Articles and Presentations.

Summary of procedure for calculating economic values using two metrics in BenMAP-C E
  • BenMAP Home
  • How BenMAP-CE Estimates the Health and Economic Effects of Air Pollution
  • Questions BenMAP-CE Can Help Answer
  • Downloads
  • Reduced-Form Tools for Calculating PM2.5 Benefits
  • Applications: Articles and Presentations
  • Training Materials
  • Manual and Appendices for BenMAP-CE
Contact Us to ask a question, provide feedback, or report a problem.
Last updated on August 10, 2022
United States Environmental Protection Agency

Discover.

  • Accessibility Statement
  • Budget & Performance
  • Contracting
  • EPA www Web Snapshot
  • Grants
  • No FEAR Act Data
  • Plain Writing
  • Privacy
  • Privacy and Security Notice

Connect.

  • Data.gov
  • Inspector General
  • Jobs
  • Newsroom
  • Open Government
  • Regulations.gov
  • Subscribe
  • USA.gov
  • White House

Ask.

  • Contact EPA
  • EPA Disclaimers
  • Hotlines
  • FOIA Requests
  • Frequent Questions

Follow.