National Wetlands Condition Assessment 2016 Key Findings
National Wetland Condition Assessment: The Second Collaborative Survey of Wetlands in the United States
Key Findings
The National Wetland Condition Assessment: The Second Collaborative Survey of Wetlands in the United States presents the results of the 2016 survey of wetland condition in the conterminous United States.
The NWCA is one of four statistical surveys in the National Aquatic Resource Surveys (NARS) program, which is designed to assess the condition of all waters nationally over time. For more information, see the NARS history page.
The most recent report is the National Wetland Condition Assessment 2021.
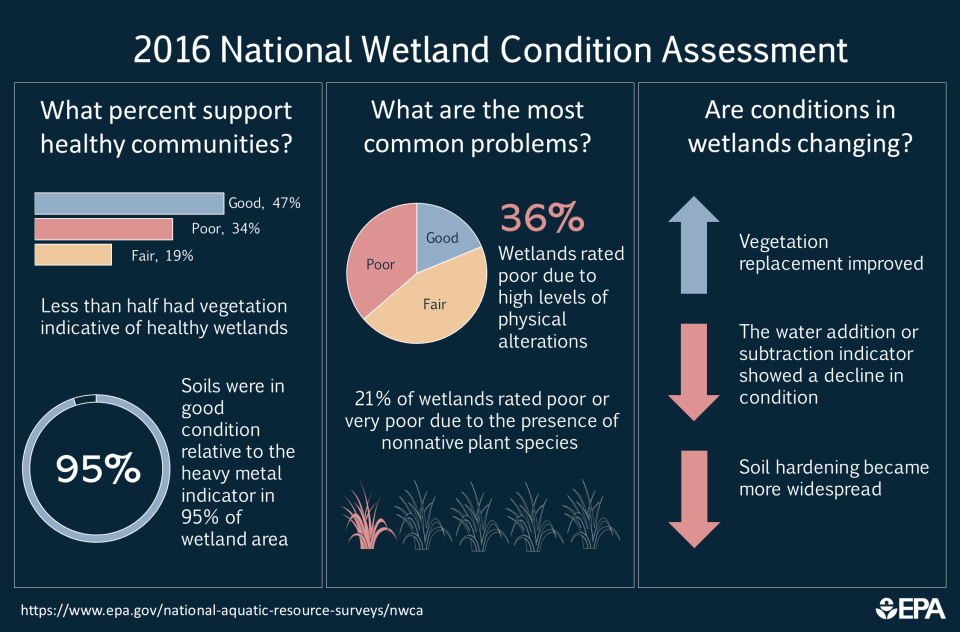
Based on an analysis of plant communities, less than half of wetland area was rated good.
- Using vegetation multimetric indexes (MMIs) to evaluate wetland condition, EPA found 47% of wetland area was in good condition. (These indexes combine results from several metrics into one value.)
Nonnative plants are a concern.
- Using an indicator based on the occurrence and abundance of nonnative plants, EPA found the condition to be poor or very poor in 21% of wetland area.
Physical alterations to wetlands are widespread. The NWCA reports on six indicators of physical alteration, based on observations at each sampling site. These human-caused alterations, shown below, directly affect vegetation, hydrology (water levels and the flow of water), or soil. The NWCA also measures the presence of multiple alterations at each site using a cumulative indicator that combines the results of the six indicators.
- Vegetation removal (e.g., logging, clearing, excessive browsing by livestock)
- Vegetation replacement (e.g., replacement with pasture or croplands)
- Water addition or subtraction (e.g., ditches or culverts that direct water into or out of the wetland)
- Flow obstruction (e.g., presence of dams or berms)
- Soil hardening (e.g., soil compaction, unpaved trails, and roads)
- Surface modification (e.g., sedimentation, erosion)
The results of the physical alteration indicators are described below.
- The combined indicator showed that 80% of wetlands were in fair or poor condition.
- Physical alteration indicators for soil hardening and water addition or subtraction were the most widespread of the six individual physical indicators; 54% and 50%, respectively, of wetland area was in fair or poor condition for these indicators.
- Most wetland area was rated good for surface modification (79%), flow obstruction (74%), vegetation replacement (69%), and vegetation removal (61%).
Chemical stressors of wetlands were not widespread, but when they were present at levels corresponding to poor conditions, the vegetation MMI score was twice as likely to also be poor.
- The NWCA reports on heavy metal concentrations in wetland soils, which can negatively impact ecological function and health. Soils were in good condition relative to the heavy metal indicator in 95% of wetland area.
- Nitrogen and phosphorus levels were measured at wetland sites where enough surface water was present to collect a water sample. Nitrogen and phosphorus conditions were found to be poor at 24% and 22% of wetland area, respectively. However, because many wetlands did not have surface water, 40% of wetland area could not be assessed for water chemistry.
- Poor condition for the vegetation MMI was twice as likely when chemical indicators for heavy metals in soils or total phosphorus in water also showed poor condition.
Algal toxins were present, but at very low levels, with minimal recreational human health concerns.
- Microcystins were detected in 8% but exceeded EPA’s recommended water quality criteria in less than 1% of wetland area. However, because many wetlands did not have surface water, 42% of wetland area could not be assessed for microcystins.