
Air Sensor Data Tools
Air sensors, especially networks of air sensors, can produce large volumes of data that must be wrangled, harmonized, processed, and visualized to help users gain insights into the air quality data collected. A number of organizations are engaged in creating free and open-sourced tools that make it easier to work with large datasets. The information below highlights some of these tools.
Disclaimers: Mention of tools, products, services, and/or trade names in this listing does not imply an endorsement by the U.S. government or the U.S. Environmental Protection Agency. The EPA does not ensure any commercial products, services, or enterprise.
On this page:
- Real Time Geospatial Data Viewer
- Sensortoolkit Python Code Library
- Air Sensor Network Analysis Tool
- Air Sensor Data Unifier
- SENsor InTellIgeNt Emissions Locator (SENTINEL)
- The Awesome Air Quality List
EPA’s Real Time Geospatial Data Viewer (RETIGO)
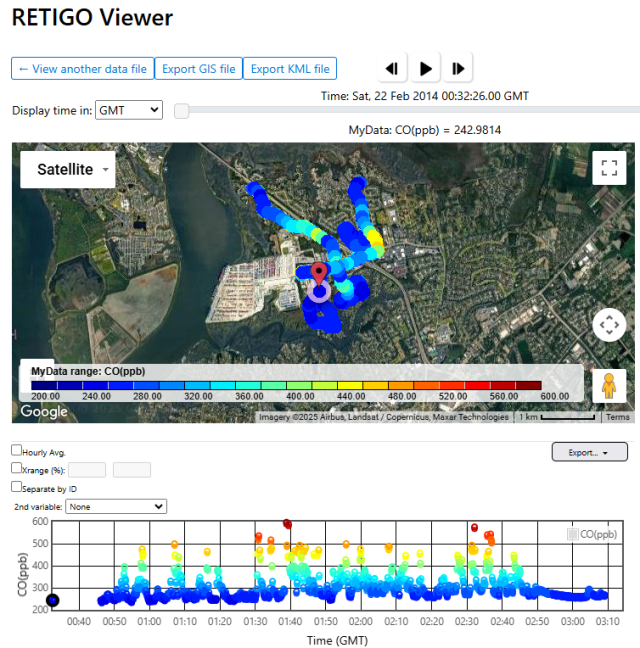
REal TIme Geospatial Data Viewer (RETIGO) is a free, web-based tool that allows users to visualize the environmental data that they collect. User-collected data can be either stationary or mobile (e.g., air quality sensors added to a bike). Version 4 is currently available. Release of version 5 is expected in late 2025.
- Individuals can use RETIGO to explore the environmental data that they collected on a map and on a time series plot.
- Publicly available data from nearby air quality and meteorological stations can be added to the display for comparison or to give more context to the user supplied data.
- Clickable options allow users to edit the display, create additional plots, switch between pollutants or variables measured, overlay satellite data products, and to download data and maps.
- Data do not move from the user’s computer, unless you decide to post your data to the public RETIGO data repository.
- A time stamp converter and tutorial page are available to assist users in properly formatting their data and in using the tool and the variety of functions available.
EPA’s sensortoolkit Python Code Library
Sensortoolkit is a free, opensource Python code library for evaluating air sensor data. The library is intended for use with air sensors collocated at ambient monitoring sites alongside regulatory air quality monitors.
- Sensortoolkit allows for comparison and analysis of sensor data against collocated reference data.
- Users supply information about the monitoring site, the equipment being tested, and data files from each of the air sensors tested. Reference data from the ambient air monitoring network can be uploaded or pulled from data repositories (e.g., AQS, AirNow).
- The library contains a robust data ingestion module, allowing data to be reformatted so that sensor and reference data can be compared for analysis.
- Air sensor performance is evaluated using the performance metrics and targets recommended in the Air Sensor Performance Target Reports.
- Results for base testing (field evaluation at an ambient monitoring site) only can be compiled in the same format as shown in the reporting template included in the Reports (see Appendix F in each report).
- Users can download sensortoolkit and run it on their computer provided they have installed Python, a free opensource programming language.
Sensortoolkit is available from:
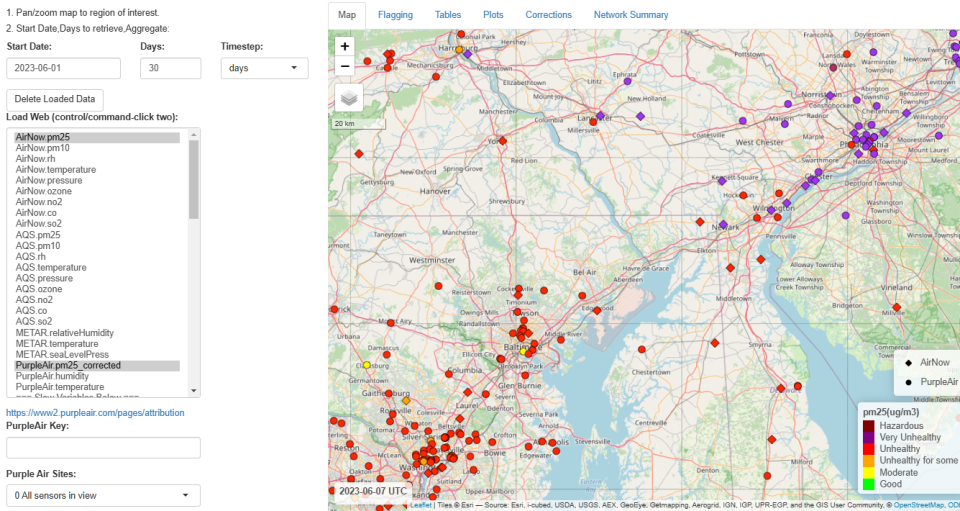
EPA’s Air Sensor Network Analysis Tool
The Air Sensor Network Analysis Tool (ASNAT) is a free, opensource R shiny application that can be used to analyze air sensor network data to understand sensor performance and local air quality conditions.
- ASNAT allows users to explore air quality data from a network of air sensors, government monitors, and weather stations.
- Users can start with public data supplied through EPA’s Remote Sensing Information Gateway (RSIG) including PM2.5 from PurpleAir sensors, pollutants measured by the ambient air monitoring network (e.g., AQS, AirNow), and meteorological data (e.g., temperature, relative humidity) measured near airports (e.g., METAR).
- Sensor performance can be explored by comparing sensors with the nearest air monitors (e.g., AQS, AirNow) in a similar manner similar to EPA’s air sensor performance targets.
- Basic quality control functions can be applied to the sensor data to flag and/or remove problematic data. Data correction functions can be used to determine and then apply a correction to increase the comparability between datasets.
- ASNAT generates tables, figures, and statistics that allow users to understand the performance of a sensor network relative to the air monitoring network and local air quality conditions.
- The target audience is air quality professionals since some background knowledge of air quality is needed to make informed decisions about nearest neighbor distance, which outliers to remove, development of an appropriate correction, and user selection needed for some tool functionality.
- The tool is available from GitHub, a code sharing website where you can find code packages. Users can download ASNAT and run it on their computer provided they have installed R, a free opensource software. Extensive knowledge of R or programming is not required.
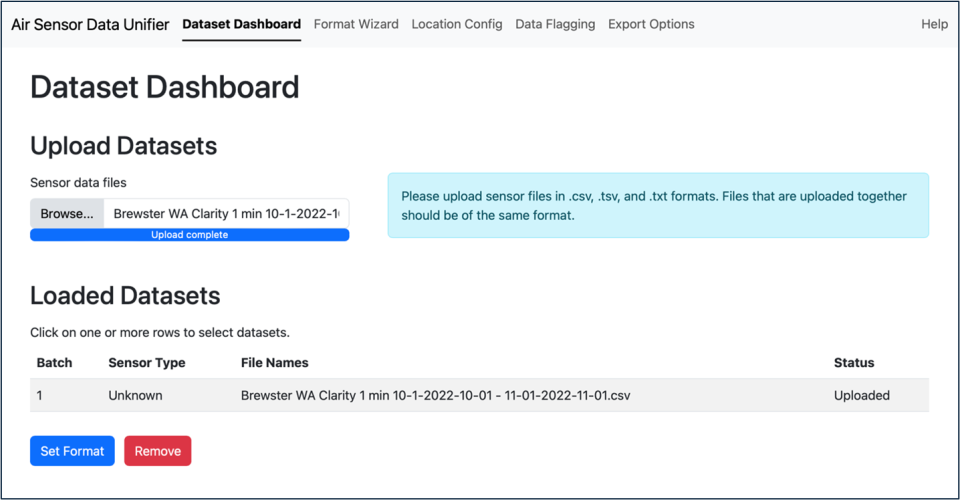
EPA's Air Sensor Data Unifier
The Air Sensor Data Unifier (ASDU) is a free, opensource R shiny application that allows users to reformat data from their own sensor networks into ASNAT and other common formats.
- ASDU accepts text format data (i.e., .csv, .txt, .tsv).
- Quality assurance data flagging can be applied based on missing values, minimum or maximum values, repeat values, and outliers.
- Data can be averaged to common intervals including hourly and daily.
- Export options include the ASNAT standard format file, keyhole markup language (KML) (for use in Google Earth or Geographic Information System (GIS) programs), and the format used by RETIGO.
- The tool is available from GitHub, a code sharing website where you can find code packages. Users can download ASDU and run it on their computer provided they have installed R, a free opensource software. Extensive knowledge of R or programming is not required.
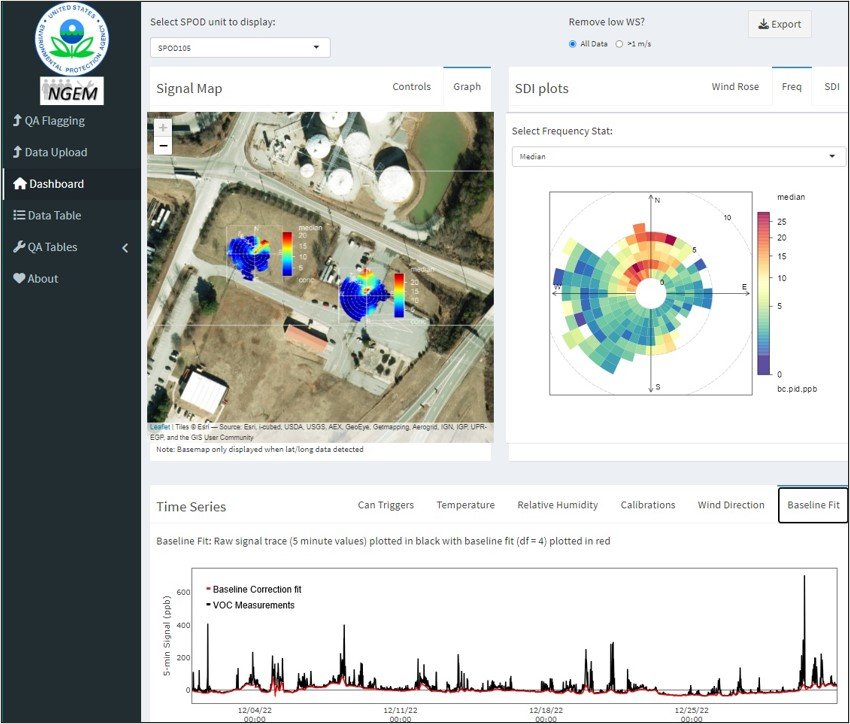
SENsor InTellIgeNt Emissions Locator (SENTINEL)
The SENsor InTellIgeNt Emissions Locator (SENTINEL) is an R Shiny application that can be used to aggregate, process, and analyze data from any fenceline sensor. This tool is designed to help users handle the vast amount of meteorological, concentration, and operational data that is collected during long running fenceline sensor deployments.
- SENTINEL is accessible as raw R code in an EPA GitHub Repository, and must be downloaded and deployed in a user’s instance of R.
- Data from any sensor can be uploaded as .csv files to the app.
- SENTINEL will apply a quality assurance flagging system and baseline correction algorithm to meteorological and concentration datapoints.
- Time series plots, geospatial visualizations, summary tables, and data reports are generated by the app and can be downloaded.
The Awesome Air Quality List
The Awesome Air Quality List is a GitHub repository initially started by OpenAQ, a nonprofit open platform for air quality data. Contributors to this list manage or have identified open-source software or hardware drivers that may be helpful to Air Sensor users. See a current list of air quality resources on the Awesome Air Quality List.
Disclaimers:
- Mention of tools, products, services, and/or trade names in this listing does not imply an endorsement by the U.S. government or the U.S. Environmental Protection Agency. The EPA does not endorse any commercial products, services, or enterprise.
- Links to repositories and to third party code libraries are added by individuals of the air quality community and are provided as a courtesy. Users assume all liability and risk.
- The EPA does not manage or monitor this list and cannot answer questions.