
Commercial Fertilizer Purchased
About this indicator
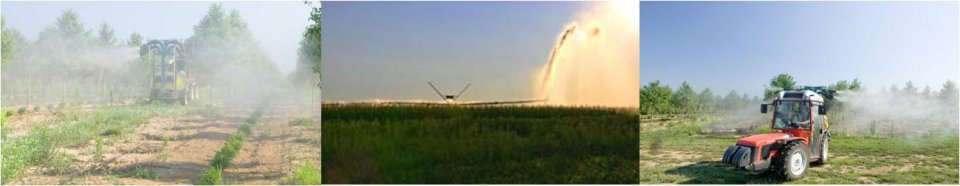
Fertilizer is a primary source of nitrogen and phosphorus and often reaches surface and groundwater systems through farm or urban/suburban runoff or infiltration. Implementing best management practices and employing precision agriculture methods to ensure appropriate fertilizer application can significantly reduce fertilizer nitrogen and phosphorus use and runoff. This indicator shows the amounts of fertilizer nitrogen and phosphorus purchased by states in years 2003, 2005, 2007, 2009, 2011, 2016, and 2017, as well as the percentage change in average amounts purchased per year during years 2007–2011 vs. years 2002–2006, and year 2011 vs. year 2017. Excluded from analysis were liming materials, peat, potting soils, soil amendments, soil additives, soil conditioners, and livestock manure.
| State | Fertilizer purchased in 2003 (1000 kg of N) |
Fertilizer purchased in 2005 (1000 kg of N) |
Fertilizer purchased in 2007 (1000 kg of N) |
Fertilizer purchased in 2009 (1000 kg of N) |
Fertilizer purchased in 2011 (1000 kg of N) |
Fertilizer purchased in 2016 (1000 kg of N) |
Fertilizer purchased in 2017 (1000 kg of N) |
Percentage change from 2002–2006 to 2007–2011* | Percentage change from 2011 to 2017 |
|---|---|---|---|---|---|---|---|---|---|
| Alabama | 90,956 | 114,387 | 106,729 | 60,319 | 68,225 | 78,301 | 81,434 | -19% | 19% |
| Alaska | 2,741 | 2,741 | 2,741 | 2,501 | 2,817 | 2,893 | 2,923 | -2% | 4% |
| Arizona | 96,855 | 89,720 | 71,420 | 89,747 | 60,041 | 50,980 | 35,976 | -23% | -40% |
| Arkansas | 265,684 | 227,586 | 297,798 | 213,021 | 223,361 | 273,419 | 194,066 | -3% | -13% |
| California | 792,148 | 694,217 | 670,619 | 609,774 | 672,302 | 390,003 | 306,817 | -8% | -54% |
| Colorado | 110,324 | 115,719 | 130,718 | 121,902 | 152,647 | 129,610 | 142,452 | 16% | -7% |
| Connecticut | 10,791 | 8,284 | 10,634 | 8,889 | 8,480 | 7,071 | 5,883 | -15% | -31% |
| Delaware | 15,364 | 15,759 | 17,730 | 18,451 | 20,181 | 15,487 | 19,051 | 24% | -6% |
| Florida | 204,011 | 210,484 | 195,075 | 137,725 | 146,542 | 95,680 | 73,296 | -22% | -50% |
| Georgia | 154,006 | 147,884 | 167,766 | 113,422 | 109,857 | 136,859 | 89,829 | -22% | -18% |
| Hawaii | 12,550 | 12,550 | 12,550 | 11,578 | 12,881 | 13,230 | 13,365 | -1% | 4% |
| Idaho | 192,428 | 211,142 | 203,021 | 172,028 | 210,900 | 175,046 | 216,350 | -9% | 3% |
| Illinois | 717,834 | 836,437 | 950,530 | 948,223 | 964,434 | 937,947 | 958,393 | 11% | -1% |
| Indiana | 463,811 | 531,979 | 510,904 | 487,380 | 516,263 | 460,059 | 586,023 | 7% | 14% |
| Iowa | 860,894 | 940,910 | 1,091,559 | 936,589 | 1,214,110 | 1,150,044 | 1,202,495 | 16% | -1% |
| Kansas | 617,369 | 661,394 | 824,216 | 628,161 | 601,499 | 670,396 | 773,312 | 8% | 29% |
| Kentucky | 179,037 | 174,617 | 200,739 | 164,229 | 179,875 | 212,961 | 197,070 | -2% | 10% |
| Louisiana | 184,113 | 191,609 | 191,288 | 178,056 | 203,915 | 221,634 | 217,907 | 11% | 7% |
| Maine | 21,178 | 30,439 | 37,443 | 30,891 | 31,078 | 11,150 | 9,394 | 20% | -70% |
| Maryland | 41,426 | 67,238 | 11,392 | 38,003 | 39,836 | 29,851 | 55,848 | -33% | 40% |
| Massachusetts | 13,072 | 16,486 | 17,476 | 13,621 | 13,599 | 7,813 | 15,233 | -4% | 12% |
| Michigan | 214,616 | 227,079 | 243,641 | 175,800 | 200,393 | 263,310 | 234,186 | -8% | 17% |
| Minnesota | 575,280 | 573,841 | 630,108 | 569,554 | 666,979 | 706,798 | 678,548 | 6% | 2% |
| Mississippi | 186,206 | 115,483 | 153,519 | 98,040 | 107,933 | 100,629 | 101,651 | -20% | -6% |
| Missouri | 402,742 | 420,645 | 476,829 | 353,128 | 431,119 | 446,900 | 466,034 | -1% | 8% |
| Montana | 117,047 | 106,200 | 158,226 | 138,305 | 228,141 | 214,046 | 208,606 | 38% | -9% |
| Nebraska | 700,200 | 735,424 | 733,803 | 790,434 | 850,422 | 866,331 | 811,994 | 10% | -5% |
| Nevada | 9,648 | 8,663 | 10,602 | 9,410 | 9,246 | 7,733 | 7,813 | -1% | -16% |
| New Hampshire | 3,205 | 3,926 | 4,510 | 4,081 | 4,243 | 2,444 | 2,077 | 2% | -51% |
| New Jersey | 24,172 | 23,603 | 25,313 | 26,020 | 20,904 | 24,961 | 21,610 | -1% | 3% |
| New Mexico | 35,557 | 36,944 | 44,142 | 35,655 | 26,240 | 20,871 | 20,882 | -5% | -20% |
| New York | 69,705 | 75,038 | 72,843 | 57,185 | 70,747 | 100,645 | 101,689 | -11% | 44% |
| North Carolina | 139,140 | 151,515 | 189,244 | 130,629 | 155,102 | 161,420 | 162,870 | 1% | 5% |
| North Dakota | 474,384 | 529,708 | 577,922 | 386,125 | 649,113 | 839,905 | 729,401 | 12% | 12% |
| Ohio | 393,350 | 375,008 | 329,679 | 357,747 | 306,996 | 304,506 | 389,092 | -6% | 27% |
| Oklahoma | 315,213 | 238,106 | 228,405 | 248,299 | 259,305 | 262,134 | 237,380 | -3% | -8% |
| Oregon | 192,496 | 171,326 | 175,643 | 126,462 | 176,867 | 119,558 | 143,309 | -7% | -19% |
| Pennsylvania | 62,488 | 77,861 | 95,757 | 103,827 | 86,632 | 114,584 | 124,559 | 13% | 44% |
| Rhode Island | 1,413 | 2,070 | 2,485 | 2,400 | 2,047 | 2,009 | 2,283 | 11% | 12% |
| South Carolina | 63,720 | 62,694 | 65,808 | 21,047 | 50,785 | 54,902 | 60,821 | -27% | 20% |
| South Dakota | 395,359 | 405,967 | 418,597 | 370,465 | 472,276 | 468,635 | 554,472 | 1% | 17% |
| Tennessee | 129,075 | 146,957 | 115,979 | 127,607 | 85,883 | 183,371 | 188,361 | -21% | 119% |
| Texas | 797,626 | 745,259 | 736,993 | 643,462 | 560,879 | 587,248 | 608,141 | -14% | 8% |
| Utah | 13,164 | 15,390 | 15,936 | 15,367 | 20,432 | 21,053 | 22,555 | 20% | 10% |
| Vermont | 4,279 | 7,904 | 6,745 | 8,207 | 8,176 | 14,370 | 12,157 | 17% | 49% |
| Virginia | 86,004 | 76,265 | 84,151 | 71,359 | 85,962 | 79,426 | 81,919 | -5% | -5% |
| Washington | 204,657 | 212,058 | 220,620 | 181,474 | 200,406 | 165,739 | 180,970 | 0% | -10% |
| West Virginia | 5,228 | 34,342 | 21,481 | 1,949 | 5,778 | 7,536 | 2,541 | -53% | -56% |
| Wisconsin | 226,508 | 223,049 | 274,394 | 252,201 | 283,808 | 321,391 | 296,587 | 10% | 5% |
| Wyoming | 84,001 | 90,542 | 91,773 | 79,016 | 165,678 | 170,173 | 171,907 | 24% | 4% |
Sources: Commercial Fertilizers annual data, 2002–2011, maintained by the Association of American Plant Food Control Officials for The Fertilizer Institute; Commercial Fertilizers annual data, 2022 report, maintained by the Association of American Plant Food Control Officials for The Fertilizer Institute
| State | Fertilizer purchased in 2003 (1000 kg of P2O5) |
Fertilizer purchased in 2005 (1000 kg of P2O5) |
Fertilizer purchased in 2007 (1000 kg of P2O5) |
Fertilizer purchased in 2009 (1000 kg of P2O5) |
Fertilizer purchased in 2011 (1000 kg of P2O5) |
Fertilizer purchased in 2016 (1000 kg of P2O5) |
Fertilizer purchased in 2017 (1000 kg of P2O5) |
Percentage change from 2002–2006 to 2007–2011* | Percentage change from 2011 to 2017 |
|---|---|---|---|---|---|---|---|---|---|
| Alabama | 44,090 | 55,450 | 52,253 | 30,683 | 39,936 | 41,831 | 43,505 | -13% | 9% |
| Alaska | 733 | 733 | 733 | 594 | 754 | 775 | 783 | -3% | 4% |
| Arizona | 32,319 | 46,129 | 28,318 | 20,071 | 20,429 | 24,302 | 17,783 | -41% | -13% |
| Arkansas | 84,605 | 74,587 | 78,079 | 47,873 | 66,212 | 88,663 | 72,861 | -21% | 10% |
| California | 207,920 | 236,867 | 250,766 | 102,797 | 172,683 | 83,574 | 57,125 | -31% | -67% |
| Colorado | 42,009 | 43,197 | 28,845 | 32,530 | 29,378 | 45,951 | 37,639 | -25% | 28% |
| Connecticut | 3,438 | 3,592 | 3,200 | 2,196 | 1,642 | 1,271 | 818 | -35% | -50% |
| Delaware | 3,768 | 3,551 | 3,409 | 2,863 | 3,264 | 2,189 | 2,764 | 19% | -15% |
| Florida | 70,104 | 64,324 | 60,847 | 35,746 | 43,162 | 25,746 | 20,886 | -33% | -52% |
| Georgia | 111,193 | 118,646 | 118,204 | 19,808 | 22,781 | 23,732 | 18,218 | -65% | -20% |
| Hawaii | 4,265 | 4,265 | 4,265 | 3,583 | 4,344 | 4,470 | 4,519 | -3% | 4% |
| Idaho | 97,713 | 93,261 | 82,568 | 65,674 | 85,963 | 67,428 | 108,715 | -9% | 26% |
| Illinois | 231,367 | 278,092 | 310,134 | 245,310 | 298,433 | 344,693 | 351,247 | -1% | 18% |
| Indiana | 181,756 | 211,126 | 185,818 | 149,008 | 196,903 | 175,601 | 155,075 | 0% | -21% |
| Iowa | 315,952 | 332,640 | 338,698 | 209,164 | 458,196 | 374,508 | 390,221 | 8% | -15% |
| Kansas | 178,441 | 188,468 | 202,775 | 146,760 | 180,621 | 155,811 | 187,085 | -3% | 4% |
| Kentucky | 89,681 | 84,179 | 95,785 | 56,916 | 70,386 | 96,403 | 96,185 | -20% | 37% |
| Louisiana | 45,269 | 34,797 | 35,227 | 24,323 | 39,165 | 42,817 | 43,539 | -5% | 11% |
| Maine | 18,270 | 26,256 | 32,297 | 25,967 | 25,935 | 5,999 | 6,130 | 19% | -76% |
| Maryland | 13,993 | 15,042 | 17,622 | 8,245 | 18,854 | 13,319 | 16,995 | -17% | -10% |
| Massachusetts | 4,267 | 5,222 | 5,065 | 3,172 | 2,744 | 1,034 | 2,473 | -28% | -10% |
| Michigan | 77,386 | 74,731 | 73,583 | 47,744 | 50,026 | 76,684 | 71,247 | -25% | 42% |
| Minnesota | 233,776 | 270,487 | 252,859 | 191,133 | 299,381 | 291,440 | 303,809 | 1% | 1% |
| Mississippi | 31,027 | 28,754 | 35,965 | 16,570 | 22,527 | 25,333 | 25,616 | -32% | 14% |
| Missouri | 170,595 | 174,269 | 178,888 | 91,626 | 173,988 | 186,773 | 194,770 | -14% | 12% |
| Montana | 60,173 | 60,008 | 73,602 | 65,801 | 69,681 | 91,176 | 84,825 | 12% | 22% |
| Nebraska | 210,829 | 247,184 | 231,818 | 274,365 | 289,017 | 252,819 | 252,223 | 10% | -13% |
| Nevada | 7,862 | 7,190 | 6,717 | 5,004 | 6,531 | 6,699 | 6,773 | -13% | 4% |
| New Hampshire | 941 | 1,291 | 1,624 | 1,045 | 1,129 | 532 | 538 | 12% | -52% |
| New Jersey | 8,470 | 8,021 | 8,712 | 6,105 | 4,321 | 5,657 | 5,285 | -24% | 22% |
| New Mexico | 10,596 | 8,108 | 13,288 | 9,548 | 10,621 | 7,004 | 7,212 | -1% | -32% |
| New York | 28,970 | 29,639 | 29,224 | 19,074 | 25,680 | 32,459 | 32,815 | -20% | 28% |
| North Carolina | 88,149 | 93,565 | 98,552 | 69,780 | 93,672 | 130,467 | 136,355 | -10% | 46% |
| North Dakota | 186,109 | 213,397 | 237,229 | 132,064 | 233,412 | 310,653 | 293,114 | 10% | 26% |
| Ohio | 158,348 | 164,924 | 146,000 | 119,679 | 98,215 | 98,100 | 146,685 | -11% | 49% |
| Oklahoma | 90,676 | 81,970 | 53,160 | 38,988 | 57,418 | 58,779 | 53,034 | -32% | -8% |
| Oregon | 48,587 | 63,083 | 58,862 | 35,023 | 40,797 | 31,175 | 32,299 | -15% | -21% |
| Pennsylvania | 28,723 | 30,573 | 31,013 | 27,459 | 25,616 | 31,296 | 29,383 | -17% | 15% |
| Rhode Island | 515 | 756 | 826 | 582 | 460 | 474 | 439 | -19% | -5% |
| South Carolina | 25,164 | 22,059 | 24,941 | 6,258 | 14,642 | 26,892 | 17,389 | -36% | 19% |
| South Dakota | 178,039 | 199,819 | 195,622 | 166,166 | 242,449 | 227,531 | 223,221 | 3% | -8% |
| Tennessee | 69,203 | 77,120 | 54,433 | 45,321 | 37,060 | 78,680 | 80,826 | -40% | 118% |
| Texas | 194,437 | 232,830 | 189,662 | 136,028 | 144,209 | 129,552 | 143,232 | -24% | -1% |
| Utah | 9,052 | 14,378 | 13,093 | 13,546 | 9,970 | 12,389 | 7,469 | 1% | -25% |
| Vermont | 2,264 | 3,095 | 2,616 | 2,314 | 1,846 | 2,810 | 2,448 | -10% | 33% |
| Virginia | 49,641 | 43,332 | 40,368 | 26,259 | 28,970 | 34,212 | 30,969 | -35% | 7% |
| Washington | 50,432 | 52,630 | 53,608 | 38,619 | 42,026 | 32,403 | 32,282 | -7% | -23% |
| West Virginia | 2,914 | 1,259 | 3,429 | 847 | 4,125 | 4,279 | 1,869 | 45% | -55% |
| Wisconsin | 64,409 | 68,040 | 78,748 | 54,947 | 80,269 | 92,367 | 94,648 | -1% | 18% |
| Wyoming | 21,392 | 22,098 | 22,399 | 19,052 | 27,799 | 28,663 | 29,005 | 1% | 4% |
Note - P2O5 is 44% phosphorus. By convention, the amount (or analysis grade) of phosphorus in fertilizers is expressed in this oxide form. Additionally, The Association of American Plant Food Control officials have developed a uniform state fertilizer bill which says that available P2O5 must be guaranteed by the manufacturer and so the guaranteed analysis of phosphorus must be expressed in the oxide form.
Sources: Commercial Fertilizers annual data, 2002–2011, maintained by the Association of American Plant Food Control Officials for The Fertilizer Institute; Commercial Fertilizers annual data, 2022 report, maintained by the Association of American Plant Food Control Officials for The Fertilizer Institute
- 2002 - 2011 Fertilizer phosphorus data table (xlsx)
- 2016 & 2017 Fertilizer phosphorus data table (xlsx)
Source of Data
- Commercial Fertilizers annual data, 2002-2011, maintained by The Association of American Plant Food Control Officials, Inc. for the Fertilizer Institute.
- Commercial Fertilizers annual data, 2022 report, maintained by The Association of American Plant Food Control Officials, Inc. for the Fertilizer Institute.
Data source information
Data are from the 2002-2011 and the 2022 Commercial Fertilizers databases, maintained by the Association of American Plant Food Control Officials (AAPFCO) for The Fertilizer Institute. With a few exceptions (refer to next section), these yearly data are based on fertilizer consumption information, in terms of fertilizer sales or shipments, reported by state fertilizer control offices to AAPFCO. The data presented are the amounts of fertilizer purchased by each state in individual years corresponding to the Commercial Fertilizers 2003, 2005, 2007, 2009, 2011, and 2022 reports. In most cases, the yearly report presents data for that “fertilizer year” or FY (from July 1st of previous year through June 30th of year of the report), but refer to the next section for exceptions. The data in the column entitled Percentage change from 2002–2006 to 2007–2011 equal the average amounts purchased in years 2007–2011 subtracted by the average amounts purchased in years 2002–2006, divided by the average amounts purchased in years 2002–2006, and converted to percentage format: ([(av 2007–2011) – (av 2002–2006)]/av 2002–2006)*100. The data in the column entitled Percentage change from 2011 to 2017 equal the amounts purchased in 2011 subtracted by the amounts purchased in 2017, divided by the amounts purchased in 2011, and converted to percentage format: [(2017 – 2011)/ 2011]*100.
What to consider when using these data
Most of the data presented here are based on fertilizer consumption information, in terms of sales or shipments, submitted by state fertilizer control offices to AAPFCO, and are for the “fertilizer year” or FY (from July 1st of previous year through June 30th of current/report year). Cases in which alternative methods were used by AAPFCO or states to obtain or report data, or data are for alternative time frames, are listed here:
- State specific alternative methods for the 2022 report include:
- Alabama - The AL Department of Agriculture provided total tons for FY2017 based on income from inspection fees. The total tonnage for FY2016 was proportioned into the tonnage for the counties and the individual materials and grades in the same ratio as that in FY1998, the state’s last detailed report.
- Colorado - The CO Department of Agriculture has changed their reporting period from fiscal to calendar year. FY2017 data are for the year beginning January 2017.
- Missouri - Missouri provided a total tonnage number for FY2017, however, no detail. The tonnage was distributed across the State based on 2016 estimate.
- North Carolina - The NC Department of Agriculture has reported only total tonnage for the fertilizer years since 1997. There were no county data or breakout of materials or mixed grades. The total tonnage for FY2017 was proportioned into the tonnage for the counties and the individual materials and grades in the same ratio as that in FY1997, the state’s last detailed report.
- For reports prior to 2022: estimation of fertilizer purchased in AL, AK, HI, and ME for all years, in UT for years 2008 and 2009, in VT for year 2010, and in WY for years 2002–2009. For these states, the AAPFCO estimates reported and used for this dataset were either:
- set as equal to a previous year’s data or estimate (AL, 2004 estimate set as equal to 2003 estimate; AK, 2003–2008 estimates set as equal to 2002 estimate; HI, 2002–2008 estimates set as equal to an original estimate by TVA ~1989; UT, 2008 estimate set as equal to 2007 data); or
- based on the last data or estimate reported by the state (AK, 2002 and 2009–2011 estimates based on the previous year’s estimate; HI, 2009–2011 estimates based on the previous year’s estimate; ME, 2002–2010 estimates based on 1994 data; UT, 2009 estimate based on 2008 estimate; VT, 2010 estimate based on 2009 data; and WY, 2002–2009 estimates based on 1993 data) with yearly adjustments derived from the weighted average of the change in the reported tonnage from surrounding states (AK and HI, 2009 estimates used 36 “surrounding” states, 2010 estimates used 45 “surrounding” states, and 2011 estimates used 46 “surrounding” states; ME, 2002–2011 estimates used CT, MA, NH and RI; UT, 2009 estimate used CO and NV; VT, 2010 estimate used 45 “surrounding” states; and WY 2002–2009 estimates used CO, ID, MT and in all years except 2009, UT); or
- based on income from inspection fees (AL, all years except 2004).
All estimates were proportioned into the amounts of individual materials and grades (and thus amounts of phosphorus vs. nitrogen) that were purchased the year of each state’s last detailed report or original estimate (AL, 1998; refer to last bullet for other states).
- Estimation of fertilizer grade (and thus amounts of phosphorus vs. nitrogen) by states or AAPFCO for some or all mixed fertilizers. This included non-farm fertilizers in CA; all mixed fertilizers in GA, NC, AL; all mixed fertilizers in AZ from 2001–2006; all mixed fertilizers in OH in 2005; specialty products in TX; and all mixed fertilizers in WI in 2002.
- In the 2002-2008 reports, data from VT, ND, and SD are for the previous calendar year.
- Data from VT (2009 report), and CO, ND and SD (2009–2011 reports) are for the calendar year (Jan-Dec of the year of the report).
- Data from OH (2006–2011 reports) are for Nov 1 of the previous year–Oct 30 of the year of the report.
- Data from TX (all years’ reports) are for Sept 1 of the previous year–Aug 31 of the year of the report.
Additionally, users should consider that the rate of delivery of nitrogen and phosphorus from land-applied fertilizer to streams is dependent on the amount, timing, and placement of application, as well as best management practices to minimize runoff from fields.
References and links to other data sources
- Ruddy, B.C., D.L. Lorenz, and D.K. Mueller. 2006. County-level estimates of nutrient inputs to the land surface of the conterminous United States, 1982–2001: U.S. Geological Survey Scientific Investigations Report 2006-5012.
- Jasinski, S.M., Kramer, D.A., Ober, J.A., and Searls, J.P. 1999. Fertilizers – Sustaining Global Food Supplies: U.S. Geological Survey Fact Sheet 155-99.
- U.S. Department of Agriculture Economic Research Service. Fertilizer Use and Price Datasets.
- The Fertilizer Institute.