
Example - Stream Monitoring
Step 1 Set Goal & Scope
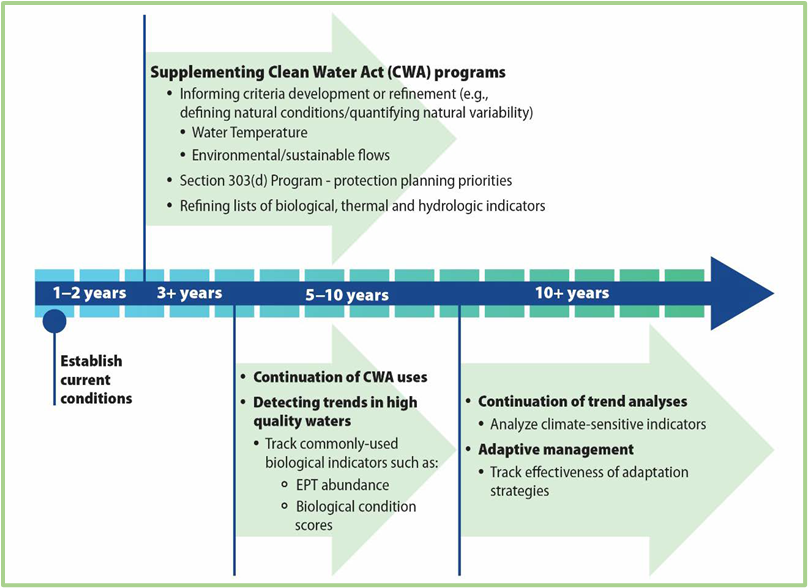
Regional Monitoring Networks (RMNs; U.S. EPA 2016) are collaborative efforts between the U.S. Environmental Protection Agency (U.S. EPA) and states, tribes, and other entities to collect long-term regional data with consistent methods. Goals include documenting current conditions, tracking changes at regional scales over time, and documenting whether changes are associated with changing thermal and hydrologic conditions (Figure 1).
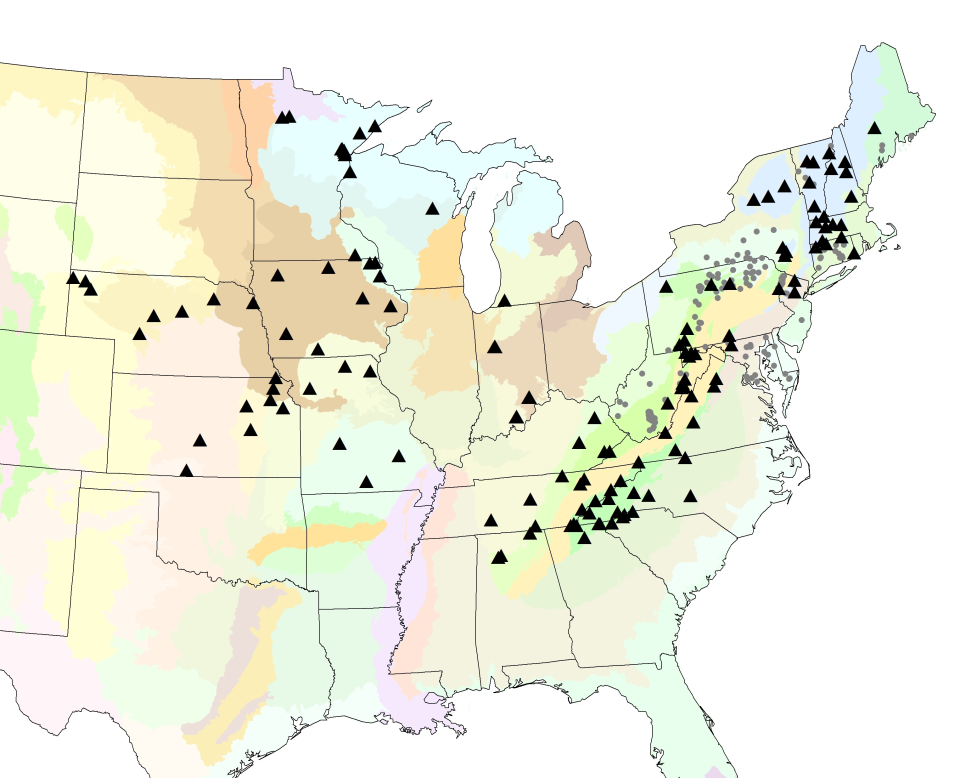
The scope includes all states and monitoring entities in the U.S. that want to participate. Data from RMN sites are combined to allow for stronger and more reliable analyses and allow the detection of the widespread environmental change patterns that may be missed at the local level. Active stream RMNs exist in the Northeast, Mid-Atlantic, Southeast, and Midwestern U.S. regions (Figure 2), with most sites having low to moderate levels of human-caused disturbance. The aim is to achieve nationwide coverage. The geographic boundaries of the RMNs typically align with U.S. EPA regions because states and tribes are the main participants at this time, and the U.S. EPA regional offices facilitate coordination and sharing of resources.
Step 2 Assess Threats & Vulnerabilities
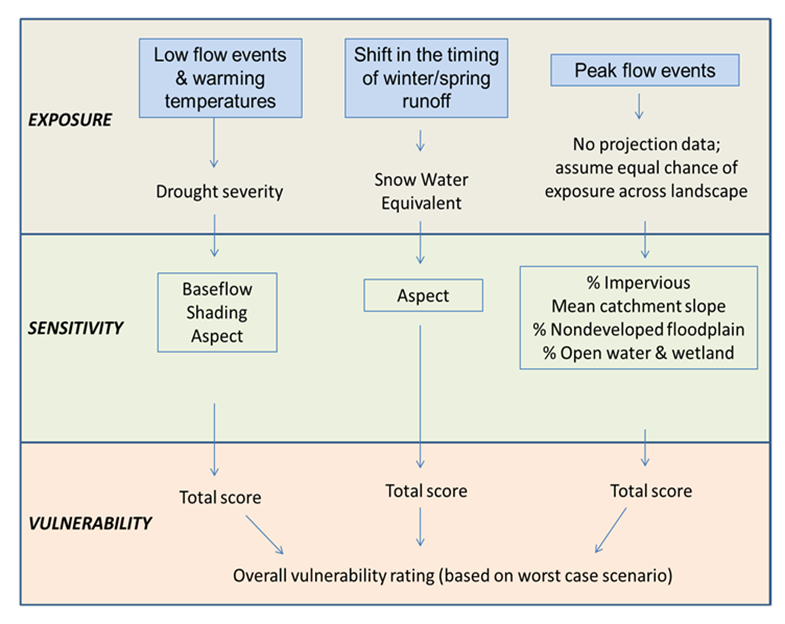
Assessments of threats and vulnerabilities have been considered to varying degrees for evaluation and prioritization of sites (Step 3) for inclusion in RMNs, as well as for indicator selection (Step 6). During the development of the Northeast RMN, sites were assigned to overall vulnerability categories based on projected changes in temperature and hydrology (exposures) in combination with sensitivity factors such as shading and baseflow (Figure 3). The RMNs are also helping partners build the capacity to better monitor threats and vulnerabilities by collecting high-frequency sensor data (U.S. EPA 2014). The sensors allow partners to document extreme thermal and hydrologic events' magnitude, frequency and duration and track whether changes are occurring as projected.
Step 3 Identify, Evaluate & Prioritize Site(s)
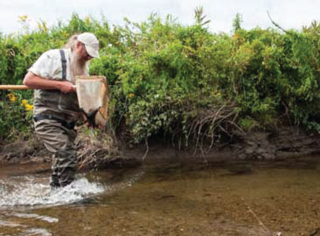
During the initial phase of establishing RMNs, the 'best available' sites with the lowest levels of human-caused disturbance (ranging from low to moderate, depending on the region) and lowest potential for future development (Figure 4) were identified because they are benchmarks against which other sites are compared. Moreover, in the absence of other stressors at high quality sites, it is more likely that effects of large-scale environmental changes will be noticed.
For site evaluation and prioritization, the level of human-caused disturbance was a major consideration but was balanced with other factors. Sites with lengthy historical records that were part of existing monitoring networks or had existing equipment, such as a U.S. Geological Survey gage, were prioritized even if the level of disturbance was higher-than-desired. Accessibility, land ownership, and opportunities for partnership or collaboration were also important considerations. Results of vulnerability assessments were considered to varying degrees. In 2012, the Northeast partners selected stream RMN sites in the 'moderate' to 'most' vulnerable categories (see Step 2).
Step 4 Identify, Design & Select Interventions
'Best-available' sites were targeted during phase one of the RMNs. While they are low priorities for restoration interventions, some sites are good candidates for protection planning.
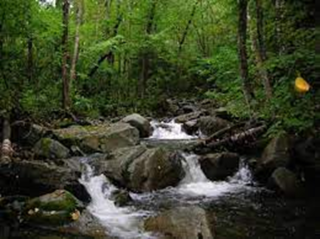
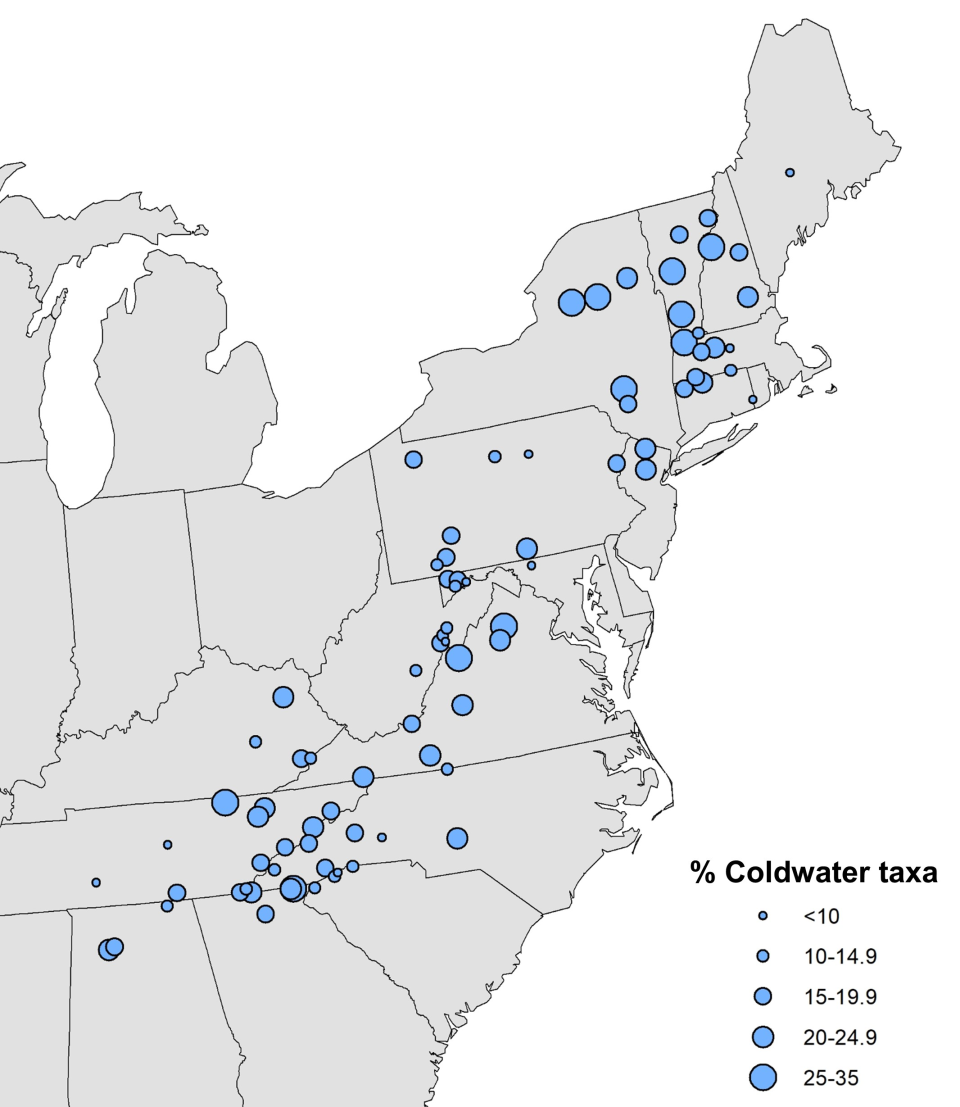
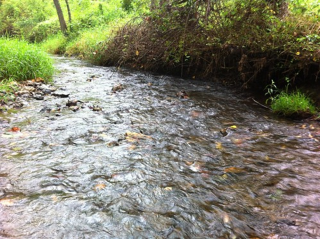
Protection planning priorities were incorporated into the 2016 Clean Water Act reporting cycle and may also be used for other EPA programs, such as the EPA Healthy Watersheds Program. While some RMN sites may have existing protections, protection planning at a regional scale has not been formally pursued. Developing strategies to help practitioners better protect high-quality sites, especially those with cold water habitats (Figure 5), will be an important future development area.

Step 5 Assemble Objectives, Targets & Action Plan
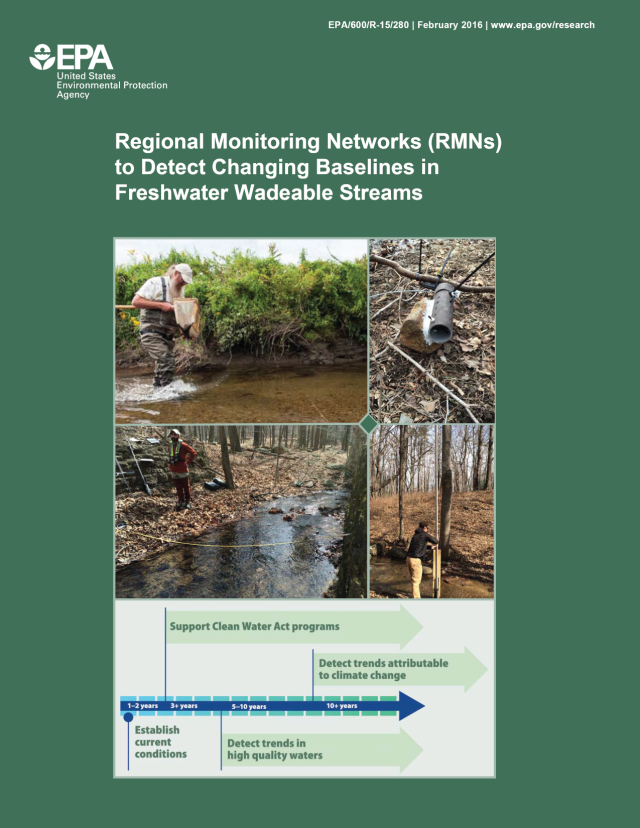
While the RMNs do not have action plans for interventions, they have reports documenting their development (Figure 6), protocol documents, and Quality Assurance Project Plans (QAPPs) that serve as action plans for implementation and achieving data quality objectives. RMN partners strive to use consistent and comparable methods whenever possible, as different methodologies may introduce biases in analyses and contribute to variability, which reduces the sensitivity of indicators and increases trend detection times.
Step 6 Implement Interventions & Monitoring
Although interventions are not being developed at RMN sites at this time, in some cases, the indicators and protocols for monitoring at RMN sites may be useful for tracking effectiveness of interventions under other projects. In addition, data from high-quality RMN sites could potentially be used to help set realistic restoration targets given ongoing environmental changes.
Step 7 Document Progress & Evaluate Success
Interventions are not necessarily implemented at specific RMN sites; however, in some cases, the indicators, protocols, and reference site data from RMNs may be useful for documenting progress and evaluating success of other projects.
For judging the progress and success of RMNs, measures of success include:
- Are data quality objectives being met?
- Are RMN data being applied and integrated into Clean Water Act programs to their fullest potential?