
Research on Emissions from U.S. Reservoirs
EPA scientists are collaborating with researchers at the U.S. Geological Survey and U.S. Department of Energy to measure methane and carbon dioxide emissions from 108 U.S. reservoirs during a four-year survey taking place from 2020 through 2023. The Survey of Reservoir Greenhouse gas Emissions (known as SuRGE) will inform a greater understanding of the amount of greenhouse gases emitted from U.S. reservoirs, and the environmental factors that determine the rate of greenhouse gas emissions from reservoirs.
On this page:
- Sources of Greenhouse Gases in Reservoirs
- Survey Design
- Data Collection Sources
- Methods for Measuring Reservoir Emissions
- Next Steps
- Related Research
- Learn More
Sources of Greenhouse Gases in Reservoirs
Greenhouse gases, carbon dioxide and methane are produced through the natural decomposition of organic matter in nearly all aquatic ecosystems, including reservoirs. EPA is quantifying greenhouse gas emissions from reservoirs because these water bodies are human-made systems, usually created for hydroelectricity or water supply via the construction of a dam. Since reservoirs are not natural systems, greenhouse gases emanating from reservoirs are considered to have an anthropogenic, or human-made, origin. EPA is obligated to report the nation’s anthropogenic greenhouse gas inventory under the United Nations Framework Convention on Climate Change, an international treaty ratified by the U.S. Congress in 1992.
Survey Design
Methane and carbon dioxide emissions measurements are being collected each year of the survey between June 1 and September 15 when there are traditionally minimal seasonal variations and temperature changes. Each reservoir is being sampled one time during the survey, at 15-25 different sites within the reservoir, depending on the size. The scientists are measuring nutrient concentrations, chlorophyll a, dissolved oxygen, pH, conductivity, water temperature, and water surface turbidity along with the methane and carbon dioxide emissions. Each of the reservoirs in this survey was previously sampled by EPA researchers during the 2017 National Lakes Assessment, part of the National Aquatic Resource Surveys (NARS) conducted by EPA along with state and tribal partners.
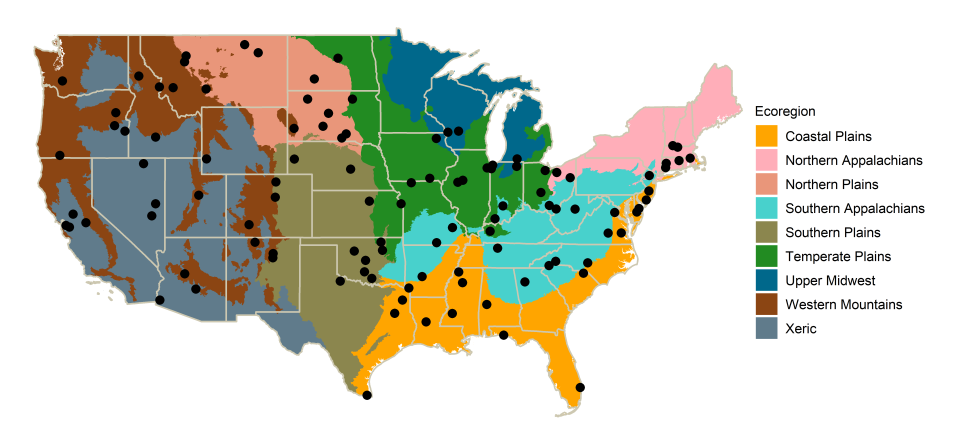
The 108 SuRGE reservoirs were randomly selected to represent the population of reservoirs within each of the nine major ecoregions in the contiguous United States. An ecoregion is an area in which climate, ecological features, and plant and animal communities are similar. The survey was further designed to capture a range of reservoir depths and chlorophyll a content within each ecoregion. Water depth and chlorophyll content are known to correlate with methane emissions, so this feature of the survey design will ensure that SuRGE includes high and low emitting reservoirs within each ecoregion. This characteristic of the SuRGE dataset will enable the development of models that can predict carbon dioxide and methane emissions from reservoirs throughout the contiguous U.S.
Data Collection Sources
Emissions data is being gathered from reservoirs distributed across 41 states and the nine major ecoregions of the contiguous United States. Ownership of the 108 reservoirs in the SuRGE Project encompass public and private lands, and tribes. Access to the reservoirs is being arranged with each local landowner.
Methods for Measuring Reservoir Emissions
During the survey, each site is being monitored by quantifying two main emission mechanisms: ebullition and diffusion.

Ebullition occurs when bubbles are released from reservoir sediment, rise vertically toward the water’s surface, and are released into the atmosphere. Methane often constitutes greater than 50 percent of gas in these bubbles and ebullition can be an important emission mechanism for this greenhouse gas. Ebullition is measured by deploying inverted funnels that capture bubbles as they rise through the water column. The diameter of these funnels is approximately two and a half feet, and the funnels are flipped upside down and hang beneath anchored buoys. The sampling devices are deployed for approximately 19 hours at 15-25 locations within each reservoir.
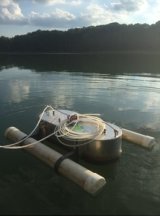
Diffusive emissions occur when greenhouse gas concentrations in the water exceed that of the atmosphere, causing the gases to move from the water into the atmosphere. Diffusion rates are quantified by deploying floating chambers for around three minutes that capture and measure these gases as they move into the atmosphere. The aluminum floating chamber is connected to a greenhouse gas analyzer on the boat that provides real-time monitoring of carbon dioxide and methane concentrations in the chamber. The chamber is buoyed by two three-feet-long horizontal tubes that float on the water’s surface.
Next Steps
Survey results will inform future research modeling efforts and provide information to help water quality managers improve water quality while helping reduce greenhouse gas emissions. Results of the survey will also be considered for inclusion in EPA’s Inventory of U.S. Greenhouse Gas Emissions and Sinks. This annual report provides a comprehensive accounting of total greenhouse gas emissions for all human-made sources in the United States.
EPA’s Inventory of U.S. Greenhouse Gas Emissions and Sinks
Related Research
Other recent research conducted by EPA scientists (Waldo, et.al., 2021) found that reservoirs with poor water quality from algal blooms, emit higher rates of methane, a greenhouse gas, than reservoirs with cleaner water. These algal blooms have been associated with excess nutrients that enter waterbodies from stormwater runoff, agriculture and industry.
Temporal trends in methane emissions from a small eutrophic reservoir: the key role of a spring burst (Research article)
EPA scientists collected high-resolution methane emission measurements that demonstrate connections between methane emission rates and three important environmental conditions: the formation of algal blooms, the temperature of sediment at the bottom of reservoirs, and the amount of pressure from the air and water above the sediment at the bottom of the reservoirs.
A possible explanation for the connection between algal blooms and methane emissions is that algae is a source of high-quality carbon that can be rapidly converted to methane by microorganisms in sediments. This important finding suggests that algal blooms not only degrade water quality and impair the recreational value of lakes and reservoirs, but also contribute to a warming climate.
Learn More
New Monitoring Method Improves Ability to Measure Methane Emissions from Reservoirs (Science Matters Newsletter)
Methane and Carbon Dioxide Emissions from Reservoirs: Controls and Upscaling (Research article)