Inventory of U.S. Greenhouse Gas Emissions and Sinks
About the Inventory of Greenhouse Gas Emissions and Sinks
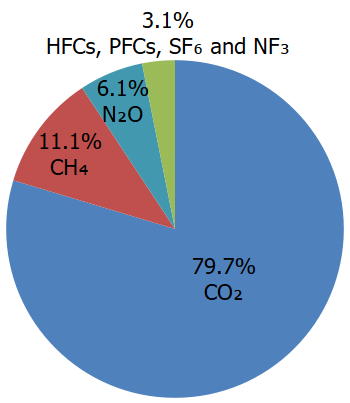
EPA develops an annual report called the Inventory of U.S. Greenhouse Gas Emissions and Sinks (Inventory), that tracks U.S. greenhouse gas emissions and sinks by source, economic sector, and greenhouse gas going back to 1990. EPA has prepared the Inventory of U.S. Greenhouse Gas Emissions and Sinks since the early 1990s. This annual report, provides a comprehensive accounting of total greenhouse gas emissions for all man-made sources in the United States, including carbon dioxide removal from the atmosphere by “sinks,” (e.g., through the uptake of carbon and storage in forests, vegetation, and soils) from management of lands in their current use or as lands are converted to other uses. The gases covered by the Inventory include carbon dioxide, methane, nitrous oxide, hydrofluorocarbons, perfluorocarbons, sulfur hexafluoride, and nitrogen trifluoride.
The national greenhouse gas inventory is submitted to the United Nations in accordance with the Framework Convention on Climate Change. In preparing the annual emissions and sinks inventory report, EPA collaborates with hundreds of experts representing more than a dozen U.S. government agencies, academic institutions, industry associations, consultants and environmental organizations. EPA also collects greenhouse gas emissions data from individual facilities and suppliers of certain fossil fuels and industrial gases through the Greenhouse Gas Reporting Program.
Trends
Key findings from the latest Inventory include:
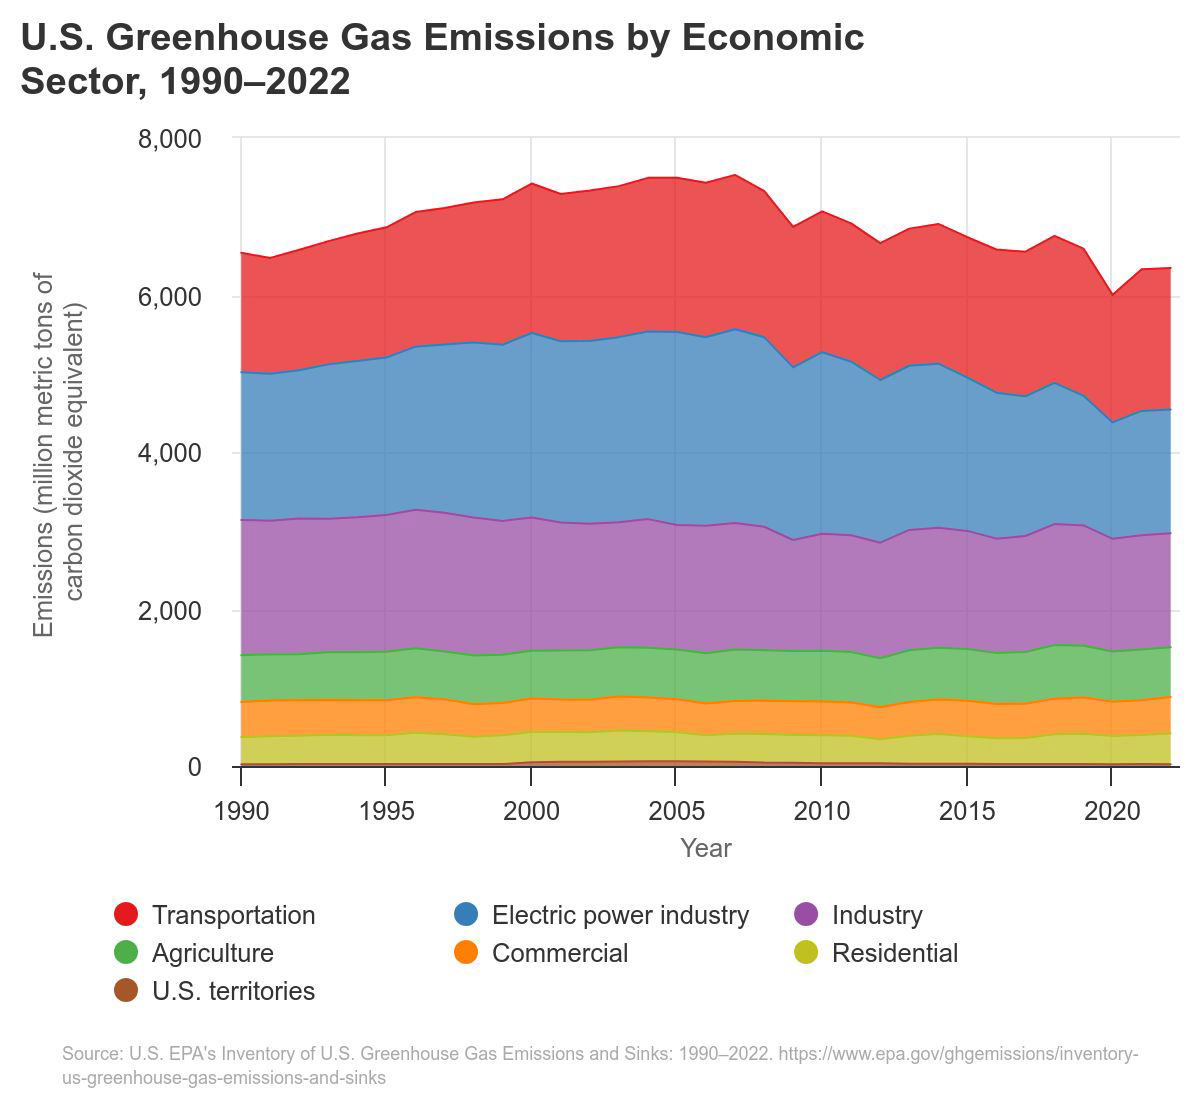
- In 2022, U.S. greenhouse gas emissions totaled 6,343 million metric tons of carbon dioxide equivalents, and 5,489 million metric tons of carbon dioxide equivalents after accounting for sequestration from the land sector.
- Emissions increased in 2022 by 1 percent (after accounting for sequestration from the land sector) compared to the previous year. The increase in total greenhouse gas emissions was driven largely by an increase in CO2 emissions from fossil fuel combustion. In 2022, CO2 emissions from fossil fuel combustion increased by 1 percent relative to the previous year. This increase in fossil fuel consumption emissions was from increased energy use, due in part to the continued rebound in economic activity after the height of the COVID-19 pandemic.
- Greenhouse gas emissions in 2022 (after accounting for sequestration from the land sector) were 17 percent below 2005 levels.
See the Data Highlights to learn more about the latest inventory findings.
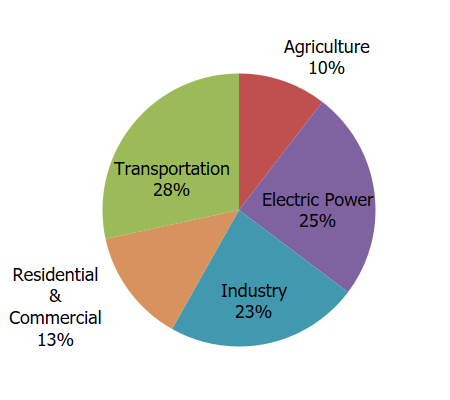
Image to save or print
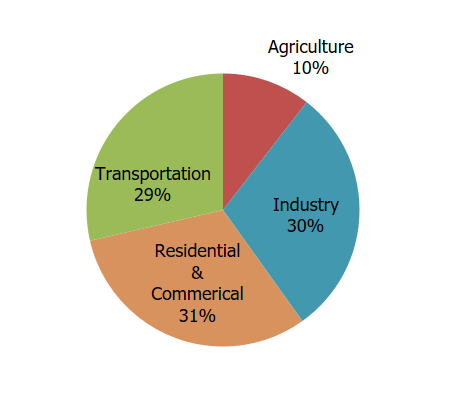
Image to save or print
Note: All emission estimates are sourced from the Inventory of U.S. Greenhouse Gas Emissions and Sinks: 1990–2022. Greenhouse gas emissions from commercial and residential buildings increase substantially when emissions from electricity end-use are included, due to the relatively large share of electricity use (e.g., heating, ventilation, and air conditioning; lighting; and appliances) in these sectors. Also, if emissions from electricity use are allocated to the industrial end-use sector, industrial activities account for a much larger share of U.S. greenhouse gas emissions. Land Use, Land-Use Change, and Forestry in the United States is a net sink and offsets 13% of these greenhouse gas emissions. This net sink is not shown in the above diagram.
Explore the Data
EPA has developed an interactive tool that provides access to data from the national greenhouse gas inventory. Visit the Greenhouse Gas Inventory Data Explorer to create customized graphs, examine trends over time, and download the data. The graph below is an example from EPA’s Greenhouse Gas Inventory Data Explorer. Click the image to enter the tool and explore an interactive version of the graph.