
Commercial and Residential Sector Emissions
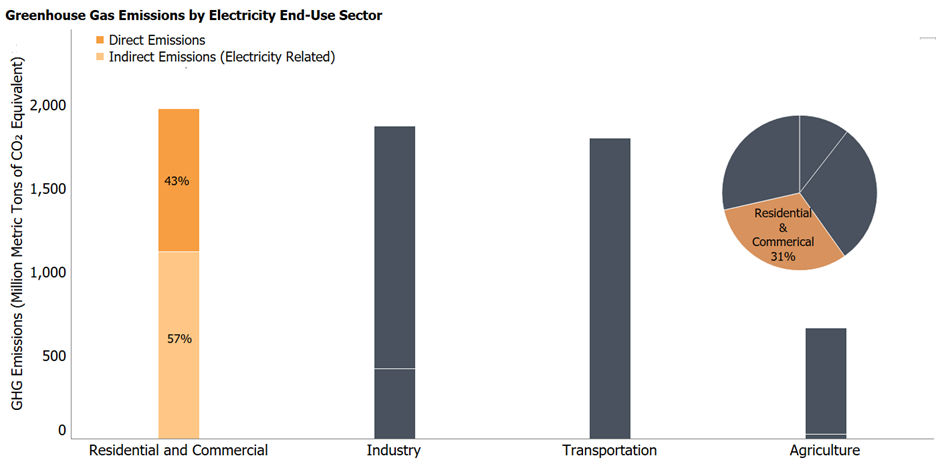
Total Emissions in 2022 = 6,343 Million Metric Tons of CO₂ equivalent. Percentages may not add up to 100% due to independent rounding. Land Use, Land-Use Change, and Forestry in the United States is a net sink and offsets 12% of these greenhouse gas emissions. This net sink is not shown in the above diagram. All emission estimates are sourced from the Inventory of U.S. Greenhouse Gas Emissions and Sinks: 1990–2022.
On this page:
- Sources of Residential and Commercial Emissions
- Commercial and Residential Sector Emissions Trends
- Reducing Emissions from Homes and Businesses
Sources of Residential and Commercial Emissions
The residential and commercial sectors include all homes and commercial businesses (excluding agricultural and industrial activities). Greenhouse gas emissions from this sector come from direct emissions including fossil fuel combustion for heating and cooking needs, management of waste and wastewater, and leaks from refrigerants in homes and businesses, as well as indirect emissions from the use of electricity by homes and businesses (e.g., heating, ventilation, and air conditioning; lighting; and appliances, and plug loads). The building sector uses 75% of the electricity generated in the US.1
Direct emissions are produced from residential and commercial activities in a variety of ways:
- Combustion of natural gas and petroleum products for heating and cooking emits carbon dioxide (CO2), methane (CH4), and nitrous oxide (N2O). Emissions from natural gas consumption represent 78% of the direct fossil fuel CO2 emissions from the residential and commercial sector in 2022. Coal consumption is a minor component of energy use in both of these sectors.
- Organic waste sent to landfills emits CH4.
- Wastewater treatment plants emit CH4 and N2O.
- Anaerobic digestion at biogas facilities emits CH4.
- Fluorinated gases (mainly hydrofluorocarbons, or HFCs) used in air conditioning and refrigeration systems can be released during servicing or from leaking equipment.
Indirect emissions are produced by burning fossil fuel at a power plant to make electricity, which is then used in residential and commercial activities, such as lighting and for appliances.
Note: Residential and commercial sector emissions presented here do not necessarily represent the full suite of emissions related to buildings and the broader built environment. The commercial and residential sectors numbers don’t include any emissions/sinks from production of construction materials (e.g., upstream emissions from production of cement, emissions and sinks from land use changes, etc.). Those would be reflected in other sectors. Also, as shown above, emissions from these sectors include other emissions that do not occur at the building site (i.e., landfills, etc.). Furthermore, energy use in these sectors may also include energy used for equipment (such as motor gasoline used for non-highway vehicles or lawn and garden equipment), exterior lighting, or construction. In addition, energy use for some large buildings, such as energy-intensive office buildings and factories with large onsite combustion, are typically included in industrial sector energy use.
More national-level information about emissions from the residential and commercial sector can be found in the U.S. GHG Inventory's Trends in Greenhouse Gas Emissions and Energy chapters (Chapters 2 and 4 respectively).
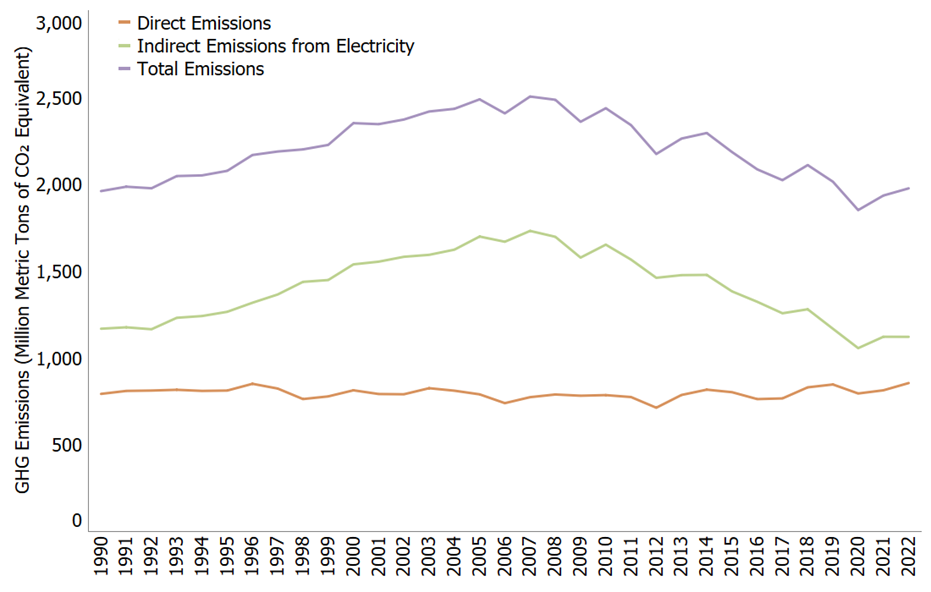
Commercial and Residential Sector Emissions Trends
- In 2022, direct and indirect greenhouse gas emissions from homes and businesses accounted for 31% of total U.S. greenhouse gas emissions.
- Direct emissions from commercial and residential were 13% of total U.S. greenhouse gas emissions in 2022.
- Greenhouse gas emissions from homes and businesses vary from year to year, often correlated with annual fluctuations in energy use caused primarily by weather conditions. Total residential and commercial greenhouse gas emissions, including direct and indirect emissions, in 2022 have increased by less than 1% since 1990. Greenhouse gas emissions from on-site direct emissions in homes and businesses have increased by 8% since 1990. Indirect emissions from electricity use by homes and businesses increased from 1990 to 2007 but have decreased since then to approximately 4% below 1990 levels in 2021.
Reducing Emissions from Homes and Businesses
The table shown below provides examples of opportunities to reduce emissions from homes and businesses. For a more comprehensive list of options and a detailed assessment of how each option affects different gases, see Chapter 9 and Chapter 12 of the Contribution of Working Group III to the Sixth Assessment Report of the Intergovernmental Panel on Climate Change.
| Type | How Emissions Are Reduced | Examples |
|---|---|---|
| Homes and Commercial Buildings | Reducing energy use through energy efficiency. | Homes and commercial buildings use large amounts of energy for heating, cooling, lighting, and other functions. Energy-efficient building practices and retrofits can allow new and existing buildings to use less energy to accomplish the same functions, leading to fewer greenhouse gas emissions. Techniques to improve building energy efficiency include better insulation and building envelope improvements; more energy-efficient heating, cooling, ventilation, and refrigeration systems; efficient LED lighting; passive heating and lighting to take advantage of sunlight; and the purchase of energy-efficient appliances and electronics. Learn more about ENERGY STAR®. |
| Wastewater Treatment | Making water and wastewater systems more energy-efficient. | Drinking water and wastewater systems account for approximately 2% of energy use in the United States. By incorporating energy efficiency practices into their water and wastewater plant, municipalities and utilities can save 15 to 30% in energy use. Learn more about Energy Efficiency for Water and Wastewater Utilities. |
| Waste Management | Reducing solid waste sent to landfills. Capturing and using methane produced in current landfills. |
When solid waste decomposes in landfills, it creates landfill gas, which is primarily comprised of CO2 and CH4. There are a number of well established, low-cost methods to reduce greenhouse gases from consumer waste, including recycling programs, waste reduction programs, and landfill methane capture programs.
|
| Air Conditioning and Refrigeration | Reducing leakage from air conditioning and refrigeration equipment. Using refrigerants with lower global warming potentials. | Commonly used refrigerants in homes and businesses include ozone-depleting refrigerants, and blends consisting entirely or primarily of hydrofluorocarbons (HFCs). Both HCFCs and HFCs are potent greenhouse gases. In recent years there have been several advancements in air conditioning and refrigeration technology that can help homes and businesses reduce both refrigerant charges and refrigerant emissions. For instance, in the retail food sector, learn more about EPA's GreenChill Program to reduce greenhouse gas emissions from supermarkets. |
References
1. National Renewable Energy Laboratory (2023). NREL Researchers Reveal How Buildings Across United States Do—and Could—Use Energy. Shoemaker, Susannah