Climate Change Indicators: Atmospheric Concentrations of Greenhouse Gases
This indicator describes how the levels of major greenhouse gases in the atmosphere have changed over time.
Key Points
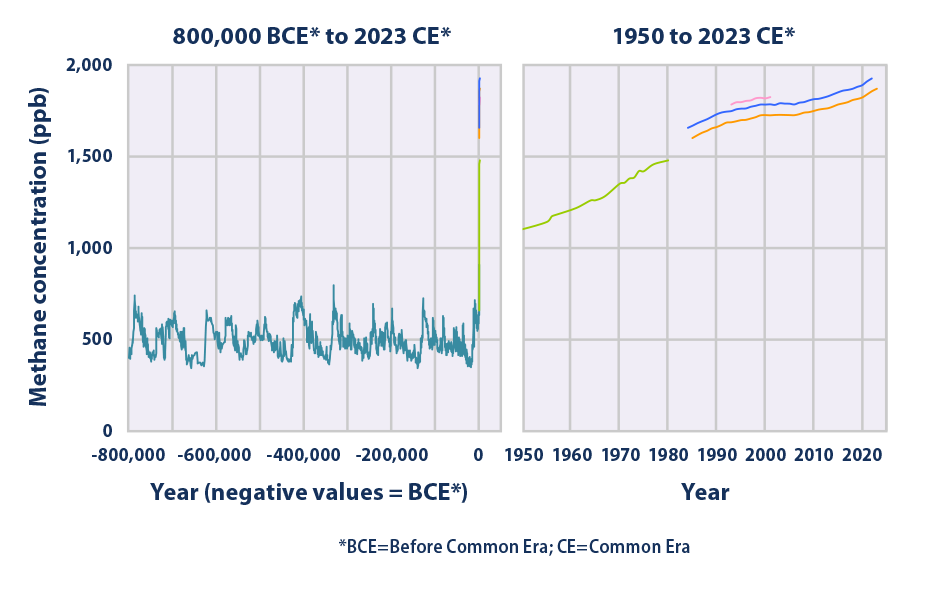
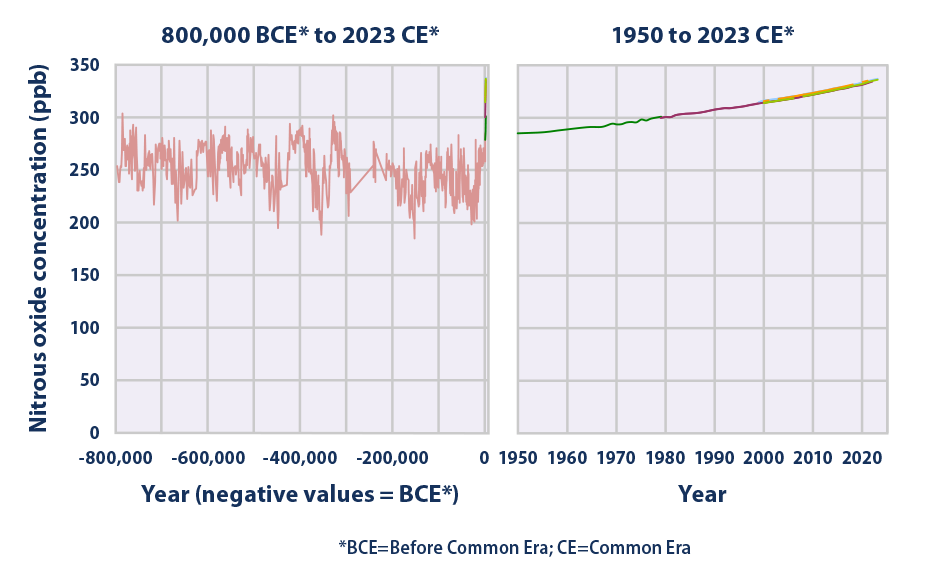
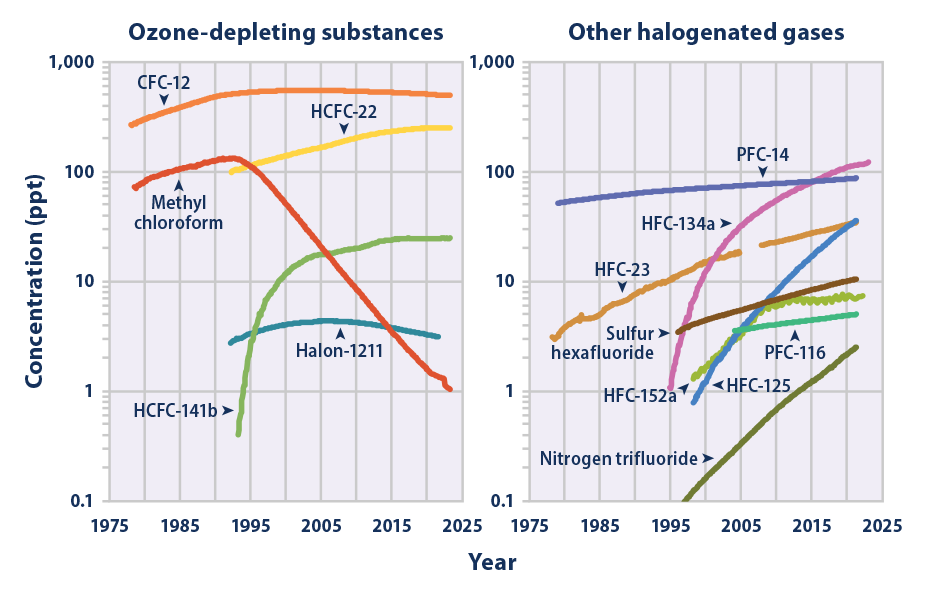
- Global atmospheric concentrations of carbon dioxide, methane, nitrous oxide, and certain manufactured greenhouse gases have all risen significantly over the last few hundred years (see Figures 1, 2, 3, and 4).
- Historical measurements show that the current global atmospheric concentrations of carbon dioxide, methane, and nitrous oxide are unprecedented compared with the past 800,000 years (see Figures 1, 2, and 3).
- Carbon dioxide concentrations have increased substantially since the beginning of the industrial era, rising from an annual average of 280 ppm in the late 1700s to 419 ppm in 2023 (average of five sites in Figure 1)—a 49 percent increase. Almost all of this increase is due to human activities.1
- The concentration of methane in the atmosphere has more than doubled since preindustrial times, reaching over 1,800 ppb in recent years (see the range of measurements for 2020 through 2023 in Figure 2). This increase is predominantly due to agriculture and fossil fuel use.2
- Over the past 800,000 years, concentrations of nitrous oxide in the atmosphere rarely exceeded 280 ppb. Levels have risen since the 1920s, however, reaching a new high of 336 ppb in 2022 (average of four sites in Figure 3). This increase is primarily due to agriculture.3
- Concentrations of many of the halogenated gases shown in Figure 4 were essentially zero a few decades ago but have increased rapidly as they have been incorporated into industrial products and processes. Some of these chemicals have been or are currently being phased out of use because they are ozone-depleting substances, meaning they also cause harm to the Earth’s protective ozone layer. As a result, concentrations of many major ozone-depleting gases have begun to stabilize or decline (see Figure 4, left panel). Concentrations of other halogenated gases have continued to rise, however, especially where the gases have emerged as substitutes for ozone-depleting chemicals (see Figure 4, right panel).
- Overall, the total amount of ozone in the atmosphere decreased by about 4 percent between 1979 and 2020 (see Figure 5). All of the decrease happened in the stratosphere, with most of the decrease occurring between 1979 and 1994. Changes in stratospheric ozone reflect the effect of ozone-depleting substances. These chemicals have been released into the air for many years, but recently, international efforts have reduced emissions and phased out their use.
- Globally, the amount of ozone in the troposphere increased by about 12 percent between 1979 and 2020 (see Figure 5).
Background
Since the Industrial Revolution began in the 1700s, people have added a substantial amount of greenhouse gases into the atmosphere by burning fossil fuels, cutting down forests, and conducting other activities (see the U.S. and Global Greenhouse Gas Emissions indicators). When greenhouse gases are emitted into the atmosphere, many remain there for long time periods ranging from a decade to many millennia. Over time, these gases are removed from the atmosphere by chemical reactions or by emissions sinks, such as the oceans and vegetation, which absorb greenhouse gases from the atmosphere. As a result of human activities, however, these gases are entering the atmosphere more quickly than they are being removed from it, and thus their concentrations are increasing.
Carbon dioxide, methane, nitrous oxide, and certain manufactured gases called halogenated gases (gases that contain chlorine, fluorine, or bromine) become well mixed throughout the global atmosphere because of their relatively long lifetimes and because of transport by winds. Concentrations of these greenhouse gases are measured in parts per million (ppm), parts per billion (ppb), or parts per trillion (ppt) by volume. In other words, a concentration of 1 ppb for a given gas means there is one molecule of that gas in every 1 billion molecules of air. Some halogenated gases are considered major greenhouse gases due to their very high global warming potentials and long atmospheric lifetimes even if they only exist at a few ppt (see table).
Ozone is also a greenhouse gas, but it differs from other greenhouse gases in several ways. The effects of ozone depend on its altitude, or where the gas is located vertically in the atmosphere. Most ozone naturally exists in the layer of the atmosphere called the stratosphere, which ranges from approximately 6 to 30 miles above the Earth’s surface. Ozone in the stratosphere has a slight net warming effect on the planet, but it is good for life on Earth because it absorbs harmful ultraviolet radiation from the sun, preventing it from reaching the Earth’s surface. In the troposphere—the layer of the atmosphere near ground level—ozone is an air pollutant that is harmful to breathe, a main ingredient of urban smog, and an important greenhouse gas that contributes to climate change (see the Climate Forcing indicator). Unlike the other major greenhouse gases, tropospheric ozone only lasts for days to weeks, so levels often vary by location and by season.
About the Indicator
This indicator describes concentrations of greenhouse gases in the atmosphere. It focuses on the major greenhouse gases that result from human activities.
For carbon dioxide, methane, nitrous oxide, and halogenated gases, recent measurements come from monitoring stations around the world, while measurements of older air come from air bubbles trapped in layers of ice from Antarctica and Greenland. By determining the age of the ice layers and the concentrations of gases trapped inside, scientists can learn what the atmosphere was like thousands of years ago.
This indicator also shows data from satellite instruments that measure ozone density in the troposphere, the stratosphere, and the “total column,” or all layers of the atmosphere. These satellite data are routinely compared with ground-based instruments to confirm their accuracy. Ozone data have been averaged worldwide for each year to smooth out the regional and seasonal variations.
About the Data
Indicator Notes
This indicator includes several of the most important halogenated gases, but some others are not shown. Many other halogenated gases are also greenhouse gases, but Figure 4 is limited to a set of common examples that represent most of the major types of these gases. The indicator also does not address certain other pollutants that can affect climate by either reflecting or absorbing energy. For example, sulfate particles can reflect sunlight away from the Earth, while black carbon aerosols (soot) absorb energy. Data for nitrogen trifluoride (Figure 4) reflect modeled averages based on measurements made in the Northern Hemisphere and some locations in the Southern Hemisphere, to represent global average concentrations over time. The global averages for ozone only cover the area between 50°N and 50°S latitude (77 percent of the Earth’s surface), because at higher latitudes the lack of sunlight in winter creates data gaps and the angle of incoming sunlight during the rest of the year reduces the accuracy of the satellite measuring technique.
Data Sources
Global atmospheric concentration measurements for carbon dioxide (Figure 1), methane (Figure 2), and nitrous oxide (Figure 3) come from a variety of monitoring programs and studies published in peer-reviewed literature. Global atmospheric concentration data for selected halogenated gases (Figure 4) were compiled by the Advanced Global Atmospheric Gases Experiment and the National Oceanic and Atmospheric Administration. A similar figure with many of these gases appears in the Intergovernmental Panel on Climate Change’s Fifth Assessment Report.12 Satellite measurements of ozone were processed by the National Aeronautics and Space Administration and validated using ground-based measurements collected by the National Oceanic and Atmospheric Administration.
Technical Documentation
References
1 Marvel, K., Su, W., Delgado, R., Aarons, S., Chatterjee, A., Garcia, M. E., Hausfather, Z., Hayhoe, K., Hence, D. A., Jewett, E. B., Robel, A., Singh, D., Tripati, A., & Vose, R. S. (2023). Chapter 2: Climate trends. In USGCRP (U.S. Global Change Research Program), Fifth National Climate Assessment. https://doi.org/10.7930/NCA5.2023.CH2
2 IPCC (Intergovernmental Panel on Climate Change). (2023). Climate change 2022—Mitigation of climate change: Working Group III contribution to the Sixth Assessment Report of the Intergovernmental Panel on Climate Change (P. R. Shukla, J. Skea, R. Slade, R. Fradera, M. Pathak, A. A. Khourdajie, M. Belkacemi, R. van Diemen, A. Hasija, G. Lisboa, S. Luz, J. Malley, D. McCollum, S. Some, & P. Vyas, Eds.). Cambridge University Press. https://doi.org/10.1017/9781009157926
3 Bolster, C. H., Mitchell, R., Kitts, A., Campbell, A., Cosh, M., Farrigan, T. L., Franzluebbers, A. J., Hoover, D. L., Jin, V. L., Peck, D. E., Schmer, M. R., & Smith, M. D. (2023). Chapter 11: Agriculture, food systems, and rural communities. In U.S. Global Change Research Program, Fifth National Climate Assessment. https://toolkit.climate.gov/NCA5
4 USGCRP (U.S. Global Change Research Program). (2017). Climate science special report: Fourth National Climate Assessment (NCA4), volume I (D. J. Wuebbles, D. W. Fahey, K. A. Hibbard, D. J. Dokken, B. C. Stewart, & T. K. Maycock, Eds.). https://doi.org/10.7930/J0J964J6
5 (See full list provided below).
6 AGAGE (Advanced Global Atmospheric Gases Experiment). (2022). ALE/GAGE/AGAGE database (updated June 14, 2022) [Data set]. Retrieved March 1, 2024, from https://agage2.eas.gatech.edu/data_archive/global_mean
7 NOAA (National Oceanic and Atmospheric Administration). (2023). Halocarbons and other Atmospheric Trace Species (HATS) group (updated October 2023) [Data set]. Retrieved March 1, 2024, from https://gml.noaa.gov/aftp/data/hats/Total_Cl_Br
8 Rigby, M. (2017). Update to data originally published in: Arnold, T., Harth, C. M., Mühle, J., Manning, A. J., Salameh, P. K., Kim, J., Ivy, D. J., Steele, L. P., Petrenko, V. V., Severinghaus, J. P., Baggenstos, D., & Weiss, R. F. (2013). Nitrogen trifluoride global emissions estimated from updated atmospheric measurements. Proceedings of the National Academy of Sciences of the United States of America, 110(6), 2029–2034. https://doi.org/10.1073/pnas.1212346110
9 NASA (National Aeronautics and Space Administration). (2013). Data—TOMS/SBUV TOR data products [Data set]. Retrieved November 1, 2013, from https://science-data.larc.nasa.gov/TOR/data.html
10 NASA (National Aeronautics and Space Administration). (2021). Tropospheric ozone data from AURA OMI/MLS [Data set]. Retrieved May 1, 2022, from https://acd-ext.gsfc.nasa.gov/Data_services/cloud_slice/new_data.html
11 NASA (National Aeronautics and Space Administration). (2022). SBUV merged ozone data set (MOD) (Version 8.7, updated May 21, 2022) [Data set]. Retrieved March 1, 2024, from https://acdb-ext.gsfc.nasa.gov/Data_services/merged/index.html
12 IPCC (Intergovernmental Panel on Climate Change). (2013). Climate change 2013—The physical science basis: Contribution of Working Group I to the Fifth Assessment Report of the Intergovernmental Panel on Climate Change (T. F. Stocker, D. Qin, G.-K. Plattner, M. Tignor, S. K. Allen, A. Boschung, A. Nauels, Y. Xia, V. Bex, & Midgley, Eds.). Cambridge University Press. www.ipcc.ch/report/ar5/wg1
Atmospheric Concentrations of Greenhouse Gases: Citations for Figures 1, 2, and 3
Figure 1
Antarctic Ice Cores: approximately 805,669 BCE to 2001 CE
Bereiter, B., Eggleston, S., Schmitt, J., Nehrbass-Ahles, C., Stocker, T. F., Fischer, H., Kipfstuhl, S., & Chappellaz, J. (2015). Revision of the EPICA Dome C CO2 record from 800 to 600 kyr before present. Geophysical Research Letters, 42(2), 542–549. https://doi.org/10.1002/2014GL061957
Mauna Loa, Hawai'i: 1959 CE to 2023 CE
NOAA (National Oceanic and Atmospheric Administration). (2024). Annual mean carbon dioxide concentrations for Mauna Loa, Hawai‘i (updated March 5, 2024) [Data set]. Retrieved March 5, 2024, from https://gml.noaa.gov/ccgg/trends/data.html
Barrow, Alaska: 1974 CE to 2023 CE
Cape Matatula, American Samoa: 1976 CE to 2023 CE
South Pole, Antarctica: 1976 CE to 2023 CE
NOAA (National Oceanic and Atmospheric Administration). (2024). Monthly mean carbon dioxide concentrations for Barrow, Alaska; Cape Matatula, American Samoa; and the South Pole (updated February 12, 2024) [Data set]. Retrieved March 5, 2024, from https://gml.noaa.gov/aftp/data/trace_gases/co2/in-situ/surface
Cape Grim, Australia: 1977 CE to 2023 CE
CSIRO (Commonwealth Scientific and Industrial Research Organisation). (2024). Monthly mean baseline (background) carbon dioxide concentrations measured at the Cape Grim Baseline Air Pollution Station, Tasmania, Australia (updated January 2024) [Data set]. Retrieved March 4, 2024, from http://capegrim.csiro.au/GreenhouseGas/data/CapeGrim_CO2_data_download.csv
Shetland Islands, Scotland: 1993 CE to 2002 CE
Steele, L. P., Krummel, P. B., & Langenfelds, R. L. (2007). Atmospheric CO2 concentrations (ppmv) derived from flask air samples collected at Cape Grim, Australia, and Shetland Islands, Scotland [Data set]. Commonwealth Scientific and Industrial Research Organisation. Retrieved January 20, 2009, from https://cdiac.ess-dive.lbl.gov/trends/co2/csiro
Lampedusa Island, Italy: 1993 CE to 2000 CE
Chamard, P., Ciattaglia, L., di Sarra, A., & Monteleone, F. (2001). Atmospheric carbon dioxide record from flask measurements at Lampedusa Island. In Trends: A compendium of data on global change. U.S. Department of Energy. https://cdiac.ess-dive.lbl.gov/trends/co2/lampis.html
Figure 2
EPICA Dome C, Antarctica: approximately 797,446 BCE to 1937 CE
Loulergue, L., Schilt, A., Spahni, R., Masson-Delmotte, V., Blunier, T., Lemieux, B., Barnola, J.-M., Raynaud, D., Stocker, T. F., & Chappellaz, J. (2008). Orbital and millennial-scale features of atmospheric CH4 over the past 800,000 years. Nature, 453(7193), 383–386. https://doi.org/10.1038/nature06950
Law Dome, Antarctica: approximately 1008 CE to 1980 CE
Etheridge, D. M., Steele, L. P., Francey, R. J., & Langenfelds, R. L. (2002). Historic CH4 records from Antarctic and Greenland ice cores, Antarctic firn data, and archived air samples from Cape Grim, Tasmania. In Trends: A compendium of data on global change. U.S. Department of Energy. https://data.ess-dive.lbl.gov/portals/CDIAC
Cape Grim, Australia: 1985 CE to 2023 CE
CSIRO (Commonwealth Scientific and Industrial Research Organisation). (2024). Monthly mean baseline (background) methane concentrations measured at the Cape Grim Baseline Air Pollution Station, Tasmania, Australia (updated January 2024) [Data set]. Retrieved March 5, 2024, from https://capegrim.csiro.au/GreenhouseGas/data/CapeGrim_CH4_data_download.csv
Mauna Loa, Hawai'i: 1984 CE to 2022 CE
NOAA (National Oceanic and Atmospheric Administration). (2023). Monthly mean CH4 concentrations for Mauna Loa, Hawai‘i (updated August 28, 2023) [Data set]. Retrieved March 5, 2024, from https://gml.noaa.gov/aftp/data/trace_gases/ch4/flask/surface
Shetland Islands, Scotland: 1993 CE to 2001 CE
Steele, L. P., Krummel, P. B., & Langenfelds, R. L. (2002). Atmospheric methane record from Shetland Islands, Scotland (October 2002 version). In Trends: A compendium of data on global change. U.S. Department of Energy. https://cdiac.ess-dive.lbl.gov/trends/atm_meth/csiro/csiro-shetlandch4.html
Figure 3
EPICA Dome C, Antarctica: approximately 796,475 BCE to 1937 CE
Schilt, A., Baumgartner, M., Blunier, T., Schwander, J., Spahni, R., Fischer, H., & Stocker, T. F. (2010). Glacial–interglacial and millennial-scale variations in the atmospheric nitrous oxide concentration during the last 800,000 years. Quaternary Science Reviews, 29(1–2), 182–192. https://doi.org/10.1016/j.quascirev.2009.03.011
Antarctica: approximately 1903 CE to 1976 CE
Battle, M., Bender, M., Sowers, T., Tans, P. P., Butler, J. H., Elkins, J. W., Ellis, J. T., Conway, T., Zhang, N., Lang, P., & Clarket, A. D. (1996). Atmospheric gas concentrations over the past century measured in air from firn at the South Pole. Nature, 383(6597), 231–235. https://doi.org/10.1038/383231a0
Cape Grim, Australia: 1979 CE to 2022 CE
CSIRO (Commonwealth Scientific and Industrial Research Organisation). (2024). Monthly mean baseline (background) nitrous oxide concentrations measured at the Cape Grim Baseline Air Pollution Station, Tasmania, Australia (updated January 2024) [Data set]. Retrieved March 11, 2024, from https://capegrim.csiro.au/GreenhouseGas/data/CapeGrim_N2O_data_download.csv
South Pole, Antarctica: 1998 CE to 2023 CE
Barrow, Alaska: 1999 CE to 2023 CE
NOAA (National Oceanic and Atmospheric Administration). (2024). Monthly mean N2O concentrations for Barrow, Alaska, and the South Pole (updated February 9, 2024) [Data set]. Retrieved March 11, 2024, from www.esrl.noaa.gov/gmd/hats/insitu/cats/cats_conc.html
Mauna Loa, Hawai‘i: 2000 CE to 2021 CE
NOAA (National Oceanic and Atmospheric Administration). (2023). Monthly mean N2O concentrations for Mauna Loa, Hawai‘i (updated August 29, 2023) [Data set]. Retrieved March 11, 2024, from www.esrl.noaa.gov/gmd/hats/insitu/cats/cats_conc.html


