
Infographics of Climate Change Indicators
Explore the range of climate change indicators through illustrations and summary statistics of indicator trends. Infographics are available on these topics:
- The Changing Arctic Climate
- Climate Change & Heat
- Climate Change & Ocean Impacts
- Chemistry & Greenhouse Gases
- Climate Change & Ecology
These infographics can be used as digital products or downloaded and printed as posters. The posters are optimized for printing on a 11x17in or ANSI B paper size.
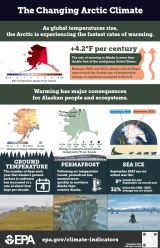
As global temperatures rise, the Arctic is experiencing the fastest rates of warming. This infographic illustrates the changes in Alaskan surface air temperature, Alaskan ground temperature, Alaskan permafrost, and Arctic Sea Ice.
View and download the poster: The Changing Arctic Climate (pdf)
Indicators featured:
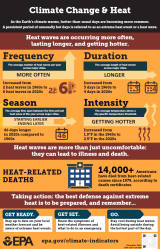
Heat waves are occurring more often, lasting longer, and getting hotter. This infographic illustrates the changes in heat waves and heat-related deaths.
View and download the poster: Climate Change & Heat (pdf)
Indicators featured:
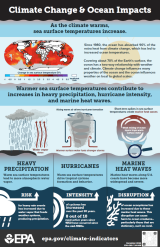
Climate Change & Ocean Impacts
As the climate warms, sea surface temperatures increase. This infographic illustrates the changes in sea surface temperatures, heavy precipitation, hurricane intensity, and marine heat waves.
View and download the poster: Climate Change & Ocean Impacts (pdf)
Indicators featured:
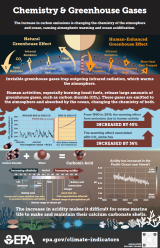
The increase in carbon emissions is changing the chemistry of the atmosphere and the ocean, causing atmospheric warming and ocean acidification. This infographic illustrates the changes in carbon dioxide in the atmosphere and ocean.
View and download the poster: Chemistry & Greenhouse Gases (pdf)
Indicators featured:

As the climate warms, the timing scale, and location of ecological events are also changing. This infographic illustrates the changes in ecological changes across land and sea.
View and download the poster: Climate Change & Ecology (pdf)
Indicators featured: