
Climate Change Indicators: Health and Society
View Indicators:


A Closer Look:
Changes in the Earth’s climate can affect public health, agriculture, water supplies, energy production and use, land use and development, and recreation. The nature and extent of these effects, and whether they will be harmful or beneficial, will vary regionally and over time. This chapter looks at some of the ways that climate change is affecting human health and society, including changes in Lyme disease, West Nile virus, ragweed pollen season, heat- and cold-related deaths and hospitalizations, heating and cooling needs, and the agricultural growing season across the United States.
Because impacts on human health are complex, often indirect, and dependent on multiple societal and environmental factors (including how people respond to these impacts), the development of appropriate health-related climate indicators is challenging and still emerging. It is important for health-related climate indicators to be clear, measurable, and timely to better understand the link between climate change and health effects.
Learn more about climate change and human health and what indicators can tell us.
Why does it matter?
Changes in climate affect the average weather conditions to which we are accustomed. These changes can result in multiple threats to human health and welfare. Warmer average temperatures will likely lead to hotter days and more frequent and longer heat waves, which could increase the number of heat-related illnesses and deaths. Increases in the frequency or severity of extreme weather events, such as storms, could increase the risk of dangerous flooding, high winds, and other direct threats to people and property. Warmer temperatures could also reduce air quality by increasing the chemical reactions that produce smog, and, along with changes in precipitation patterns and extreme events, could enhance the spread of some diseases.
In addition, climate change could require adaptation on larger and faster scales than in the past, presenting challenges to human well-being and the economy. The more extensively and more rapidly the climate changes, the larger the potential effects on society. The extent to which climate change will affect different regions and sectors of society will depend not only on the sensitivity of those systems to climate change, but also on their ability to adapt to or cope with climate change. Populations of particular concern include the poor, the elderly, those already in poor health, the disabled, and indigenous populations.
Summary of Key Points
- Heat-Related Deaths. Since 1979, more than 14,000 Americans have died directly from heat-related causes, according to death certificates. The annual death rate is higher when accounting for deaths in which heat was reported as a contributing factor, including the interaction of heat and cardiovascular disease. People aged 65+ are a particular concern: a growing demographic group that is several times more likely to die from heat-related cardiovascular disease than the general population. Considerable year-to-year variability and certain limitations of the underlying data for this indicator make it difficult to determine whether the United States has experienced long-term trends in the number of deaths classified as “heat-related.”
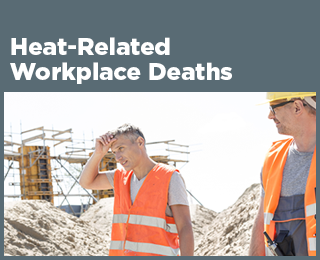
- A Closer Look: Heat-Related Workplace Deaths. Outdoor workers, particularly those engaging in strenuous physical activity, disproportionately face greater heat-related health threats. From 1992 to 2022, a total of 986 workers across all industry sectors in the United States died from exposure to heat. This represents an average of 34 deaths per year. In the same period, 334 construction workers lost their lives to heat exposure on the job—meaning that the construction sector accounted for about 34 percent of all occupational heat-related deaths.
- Heat-Related Illnesses. From 2001 to 2010, a total of about 28,000 heat-related hospitalizations were recorded across 20 states. Annual heat-related hospitalization rates ranged from fewer than one case per 100,000 people in some states to nearly four cases per 100,000 people in others. People aged 65+ accounted for more heat-related hospitalizations than any other age group from 2001 to 2010, and males were hospitalized for heat-related illnesses more than twice as often as females.
- Cold-Related Deaths. Since 1979, more than 19,000 Americans were reported to have died from exposure to cold temperatures. The annual death rate is higher when accounting for deaths in which cold was reported as a contributing factor. Some winter deaths are due to factors other than exposure to cold conditions (e.g., the flu). In other cases, even if cold exposure contributes to a death, it may not be reported as "cold-related" on a death certificate. These limitations, as well as year-to-year variability in the data and a change in classification codes in the late 1990s, make it difficult to determine whether the United States has experienced long-term trends in the number of deaths classified as "cold-related."
- Heating and Cooling Degree Days. Heating and cooling degree days measure the difference between outdoor temperatures and the temperatures that people find comfortable indoors. As the U.S. climate has warmed in recent years, heating degree days have decreased and cooling degree days have increased overall, suggesting that Americans need to use less energy for heating and more energy for air conditioning. This pattern stands out the most in the North and West, while much of the Southeast has experienced the opposite results.
- Residential Energy Use. Since 1973, the average amount of electricity used by Americans at home during the summer has nearly doubled, but it appears to have leveled off somewhat in recent years. While the long-term increase is in part related to people using more air conditioning over time as the climate gets warmer, other factors (such as energy prices, energy efficiency, and population and housing trends) could also affect the results. Conversely, the average American's winter use of natural gas (the most common home heating fuel) has decreased since 1974.
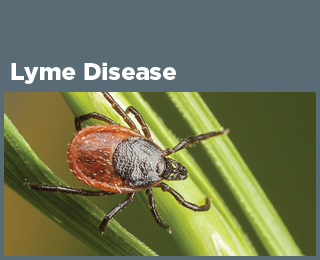
- Lyme Disease. Lyme disease is a bacterial illness spread by ticks that bite humans. Tick habitat and populations are influenced by many factors, including climate. Between 1992 and 2022, the incidence of Lyme disease in the United States has ranged from a low of 3.2 reported cases per 100,000 people in 1993 to a high of 18.8 per 100,000 people in 2022. However, changes in the way Lyme disease cases have been defined and reported over time make it challenging to identify long-term trends. Lyme disease is much more common in the Northeast, mid-Atlantic, and upper Midwest than in other regions. The CDC has identified 15 states and the District of Columbia as "high-incidence jurisdictions," which accounted for about 95 percent of the nation's reported Lyme disease cases in 2022.
- West Nile Virus. West Nile virus is spread by mosquitoes, whose habitat and populations are influenced by temperature and water availability. The incidence of West Nile virus neuroinvasive disease in the United States has varied widely from year to year and among geographic regions since tracking began in 2002. Variation in disease incidence is affected by climate and many other factors, and no obvious long-term trend can be detected yet through this limited data set.
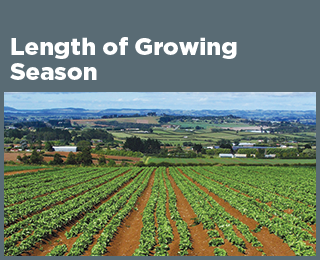
- Length of Growing Season. The length of the growing season for crops and other plants has increased in almost every state. States in the West (e.g., California and Washington) have seen the most dramatic increase. In contrast, the growing season has become slightly shorter in Georgia. The observed changes reflect earlier spring warming as well as later arrival of fall frosts. The length of the growing season has increased more rapidly in the West than in the East.
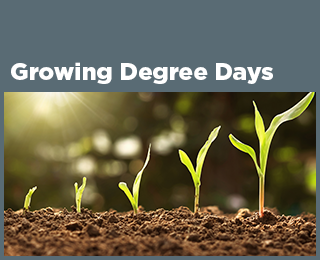
- Growing Degree Days. Growing degree days provide a useful way to look at temperature changes from the perspective of plant growth and development, as plants typically grow only when the temperature is above a certain minimum level. Since the late 1940s, the annual number of growing degree days increased at 79 percent of the locations measured across the contiguous 48 states. The average change was a 10 percent increase. The largest increases occurred in the West and the Northeast.
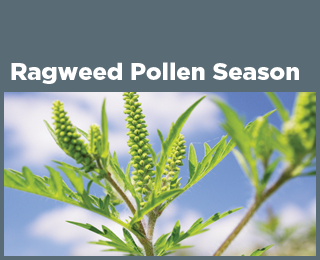
- Ragweed Pollen Season. Warmer temperatures and later fall frosts allow ragweed plants to produce pollen later into the year, potentially prolonging the allergy season for millions of people. The length of ragweed pollen season has increased at 10 out of 11 locations studied in the central United States and Canada since 1995. The change becomes more pronounced from south to north.