Climate Change Indicators: Heating and Cooling Degree Days
This indicator examines changing temperatures from the perspective of heating and cooling needs for buildings.
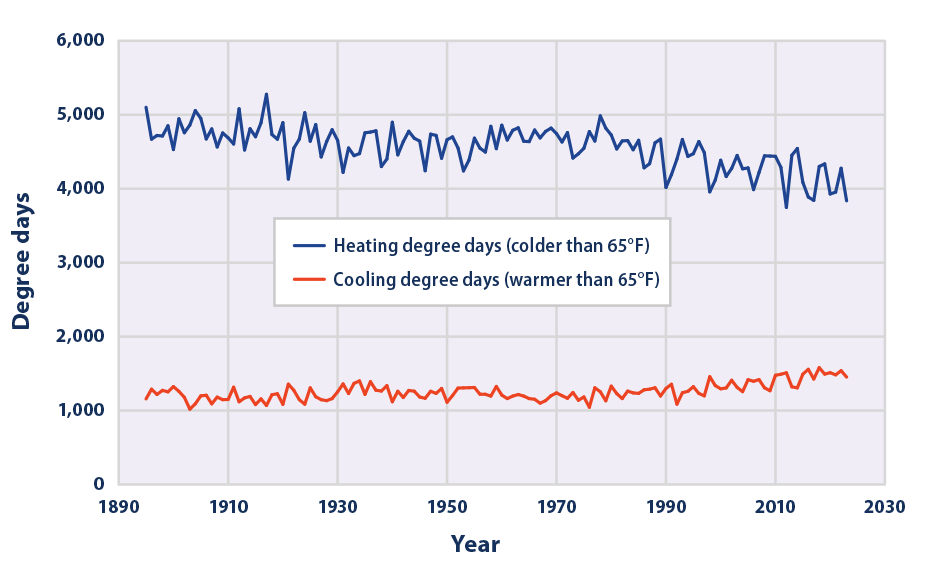
This figure shows the average number of heating and cooling degree days per year across the contiguous 48 states.
Data source: NOAA, 20243
Web update: June 2024
This map shows how the average number of heating degree days per year has changed in each state over time. The map was created by comparing the first 65 years of available data (1895–1959) with the most recent 64 years (1960–2023). “Warmer” colors indicate an increase in temperatures between the two periods, leading to less of a need to turn on the heat—that is, fewer heating degree days. “Cooler” colors indicate a decrease in temperatures, leading to more of a need to turn on the heat—that is, more heating degree days. Click on a state to reveal the trend in a line graph.
Data source: NOAA, 20243
Web update: June 2024
This map shows how the average number of cooling degree days per year has changed in each state over time. The map was created by comparing the first 65 years of available data (1895–1959) with the most recent 64 years (1960–2023). “Warmer” colors indicate an increase in temperatures between the two periods, leading to more demand for air conditioning—that is, more cooling degree days. “Cooler” colors indicate a decrease in temperatures, leading to less demand for air conditioning—that is, fewer cooling degree days. Click on a state to reveal the trend in a line graph.
Data source: NOAA, 20243
Web update: June 2024
Key Points
- Heating degree days have declined in the contiguous United States, particularly in recent years, as the climate has warmed (see Figure 1). This change suggests that heating needs have decreased overall.
- Overall, cooling degree days have increased over the past 100 years. The increase is most noticeable over the past few decades, suggesting that air conditioning energy demand has also been increasing recently (see Figure 1).
- Heating degree days have generally decreased and cooling degree days have generally increased throughout the North and West. The Southeast, with the exception of Florida, has seen the opposite: little change in heating degree days and fewer cooling degree days (see Figures 2 and 3).
Background
Outdoor temperatures can affect daily life in many ways. In particular, temperature affects our health, comfort level, and demand for heating and air conditioning. Collectively, heating and cooling the spaces in which we live accounts for 52 percent of the energy that American households use every year.1 As climate change contributes to an increase in average temperatures, an increase in unusually hot days, and a decrease in unusually cold days (see the U.S. and Global Temperature and High and Low Temperatures indicators), the overall demand for heating is expected to decline and the demand for cooling is expected to increase.
One way to measure the influence of temperature change on energy demand is using heating and cooling degree days, which measure the difference between outdoor temperatures and a temperature that people generally find comfortable indoors. These measurements suggest how much energy people might need to use to heat and cool their homes and workplaces, thus providing a sense of how climate change could affect people’s daily lives and finances.
About the Indicator
This indicator uses daily temperature data from thousands of weather stations across the United States to calculate heating and cooling degree days. A “degree day” is determined by comparing the daily average outdoor temperature with a defined baseline temperature for indoor comfort (in this case, 65°F). For example, if the average temperature on a particular day is 78°F, then that day counts as 13 cooling degree days, as a building’s interior would need to be cooled by 13°F to reach 65°F. Conversely, if the average outdoor temperature is 34°F, then that day counts as 31 heating degree days, as a building’s interior would need to be warmed by 31°F to reach 65°F. This does not mean that all people will actually heat or cool buildings to 65°F; it is just a number to allow for consistent comparisons over time and across the country. For reference, New York City experiences far more heating degree days than cooling degree days per year—a reflection of the relatively cool climate in the Northeast—while Houston, Texas, has far more cooling degree days than heating degree days—a reflection of the much warmer climate in the South.2
Figure 1 shows each year’s average heating and cooling degree days across the contiguous 48 states. Figures 2 and 3 show how heating and cooling degree days have changed by state, based on a comparison of the first 65 years of available data (1895–1959) with the most recent 64 years (1960–2023). State and national averages were calculated by finding the total number of heating and cooling degree days per year at each weather station, averaging the results from all stations within regions called climate divisions (each state within the contiguous 48 has up to 10 climate divisions), then calculating state and national averages weighted by the population of each climate division. With this population-weighting approach, average state and national heating and cooling degree days more closely reflect the conditions that the average resident would experience.
About the Data
Indicator Notes
Heating and cooling degree days suggest how temperature changes affect energy demand, but they do not necessarily reflect actual energy use. Many other factors have influenced energy demand over time, such as more energy-efficient heating systems, the introduction and increasingly widespread use of cooling technologies, larger but better-insulated homes, behavior change, and population shifts (such as more people moving to warmer regions). All of the population-weighting in this indicator is based on the population distribution according to the 2020 U.S. Census, so any changes in heating and cooling degree days over time in this indicator reflect actual changes in the climate, not the influence of shifting populations. A nationally applied baseline—in this case, 65°F—has certain limitations considering the various climate zones across the United States.
Data Sources
The data for this indicator were provided by the National Oceanic and Atmospheric Administration’s National Centers for Environmental Information, which maintains climate data online at: www1.ncdc.noaa.gov/pub/data/cirs/climdiv.
Technical Documentation
References
1 EIA (U.S. Energy Information Administration). (2023). Residential Energy Consumption Survey (RECS). www.eia.gov/consumption/residential/index.cfm
2 NOAA (National Oceanic and Atmospheric Administration). (2024). U.S. climate normals 2020: U.S. annual/seasonal climate normals (1991–2020). www.ncei.noaa.gov/access/search/data-search/normals-annualseasonal-1991-2020
3 NOAA (National Oceanic and Atmospheric Administration). (2024). NOAA Monthly U.S. Climate Divisional Database (nClimDiv). www1.ncdc.noaa.gov/pub/data/cirs/climdiv
Learn about other indicators in this section