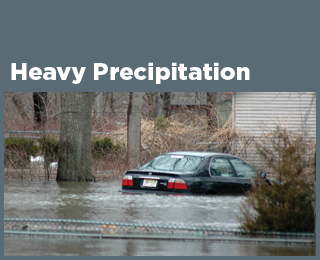
Climate Change Indicators: Heavy Precipitation
This indicator tracks the frequency of heavy precipitation events in the United States.
Figure 1. Extreme One-Day Precipitation Events in the Contiguous 48 States, 1910–2023
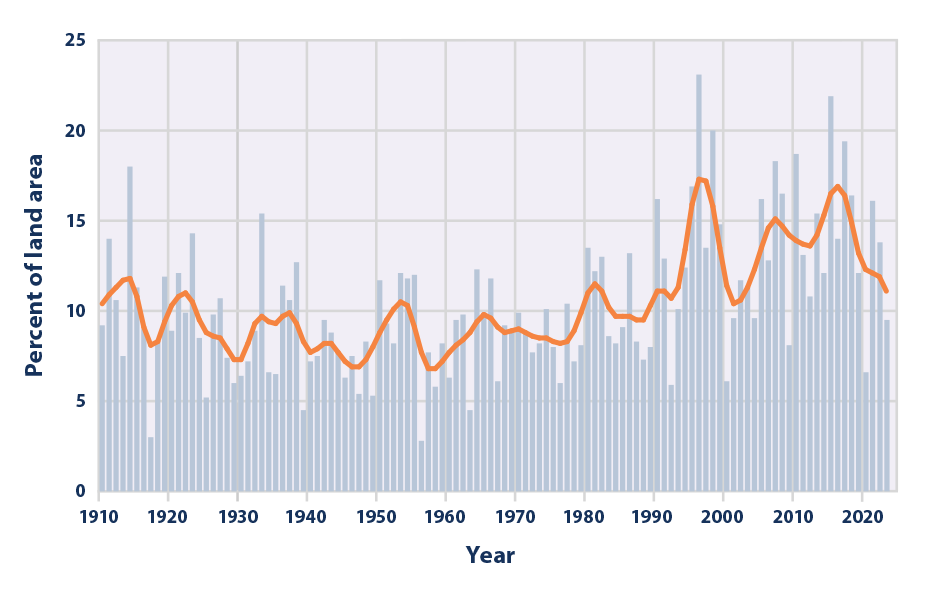
This figure shows the percentage of the land area of the contiguous 48 states where a much greater than normal portion of total annual precipitation has come from extreme single-day precipitation events. The bars represent individual years, while the line is a nine-year weighted average.
Data source: NOAA, 20244
Web update: June 2024
Figure 2. Unusually High Annual Precipitation in the Contiguous 48 States, 1895–2023

This figure shows the percentage of the land area of the contiguous 48 states that experienced much greater than normal precipitation in any given year, which means it scored 2.0 or above on the annual Standardized Precipitation Index. The thicker line shows a nine-year weighted average that smooths out some of the year-to-year fluctuations.
Data source: NOAA, 20245
Web update: June 2024
Key Points
- In recent years, a larger percentage of precipitation has come in the form of intense single-day events. Nine of the top 10 years for extreme one-day precipitation events have occurred since 1995 (see Figure 1).
- The prevalence of extreme single-day precipitation events remained fairly steady between 1910 and the 1980s, but has risen substantially since then. Over the entire period from 1910 to 2023, the portion of the country experiencing extreme single-day precipitation events increased at a rate of about half a percentage point per decade (see Figure 1).
- The percentage of land area experiencing much greater than normal yearly precipitation totals increased between 1895 and 2023. There has been much year-to-year variability, however. In some years there were no abnormally wet areas, while a few others had abnormally high precipitation totals over 10 percent or more of the contiguous 48 states’ land area (see Figure 2). For example, 1941 was extremely wet in the West, while 1983 was very wet nationwide.3
- Figures 1 and 2 are both consistent with other studies that have found an increase in heavy precipitation over timeframes ranging from single days to seasons to years.1 For more information on trends in overall precipitation levels, see the U.S. and Global Precipitation indicator.
Background
"Heavy precipitation" refers to instances during which the amount of rain or snow experienced in a location substantially exceeds what is normal. What constitutes a period of heavy precipitation varies according to location and season.
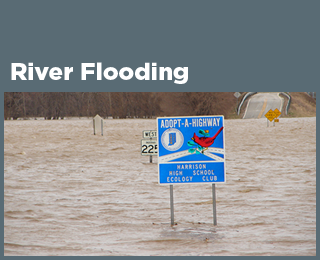
Climate change can affect the intensity and frequency of precipitation. Warmer oceans increase the amount of water that evaporates into the air. When more moisture-laden air moves over land or converges into a storm system, it can produce more intense precipitation—for example, heavier rain and snow storms.1 The potential impacts of heavy precipitation include crop damage, soil erosion, and an increase in flood risk due to heavy rains (see the River Flooding indicator)—which in turn can lead to injuries, drownings, respiratory health impacts from exposure to mold, and other flooding-related effects on health.2 In addition, runoff from precipitation can impair water quality as pollutants deposited on land wash into water bodies.
Heavy precipitation does not necessarily mean the total amount of precipitation at a location has increased—just that precipitation is occurring in more intense events. However, changes in the intensity of precipitation, when combined with changes in the interval between precipitation events, can also lead to changes in overall precipitation totals.
About the Indicator
Heavy precipitation events can be measured by tracking their frequency, examining their return period (the chance that the event will be equaled or exceeded in a given year), or directly measuring the amount of precipitation in a certain period (for example, inches of rain falling in a 24-hour period).
One way to track heavy precipitation is by calculating what percentage of a particular location’s total precipitation in a given year has come in the form of extreme one-day events—or, in other words, what percentage of precipitation is arriving in more concentrated periods of time. Figure 1 of this indicator looks at the prevalence of extreme single-day precipitation events over time.
For added insight, this indicator also tracks the occurrence of unusually high total yearly precipitation. It does so by looking at the Standardized Precipitation Index (SPI), which compares actual yearly precipitation totals with the range of precipitation totals that one would typically expect at a specific location, based on historical data. If a location experiences less precipitation than normal during a particular period, it will receive a negative SPI score, while a period with more precipitation than normal will receive a positive score. The more precipitation (compared with normal), the higher the SPI score. The SPI is a useful way to look at precipitation totals because it allows comparison of different locations and different seasons on a standard scale. Figure 2 shows what percentage of the total area of the contiguous 48 states had an annual SPI score of 2.0 or above (well above normal) in any given year.
About the Data
Indicator Notes
Weather monitoring stations tend to be closer together in the eastern and central states than in the western states. In areas with fewer monitoring stations, heavy precipitation indicators are less likely to reflect local conditions accurately.
Data Sources
The data used for this indicator come from a large national network of weather stations and were provided by the National Oceanic and Atmospheric Administration’s (NOAA’s) National Centers for Environmental Information. Figure 1 is based on Step #4 of NOAA’s U.S. Climate Extremes Index; for data and a description of the index, see: www.ncei.noaa.gov/access/monitoring/cei. Figure 2 is based on the U.S. SPI, which is shown in a variety of maps available online at: www.ncei.noaa.gov/access/monitoring/monthly-report/drought. The data used to construct these maps are available at: www.ncei.noaa.gov/pub/data/cirs/climdiv.
Technical Documentation
References
1 Marvel, K., Su, W., Delgado, R., Aarons, S., Chatterjee, A., Garcia, M. E., Hausfather, Z., Hayhoe, K., Hence, D. A., Jewett, E. B., Robel, A., Singh, D., Tripati, A., & Vose, R. S. (2023). Chapter 2: Climate trends. In USGCRP (U.S. Global Change Research Program), Fifth National Climate Assessment. https://doi.org/10.7930/NCA5.2023.CH2.
2 Bell, J. E., Herring, S. C., Jantarasami, L., Adrianopoli, C., Benedict, K., Conlon, K., Escobar, V., Hess, J., Luvall, J., Garcia-Pando, C. P., Quattrochi, D., Runkle, J., & Schreck, C. J., III. (2016). Chapter 4: Impacts of extreme events on human health. In USGCRP (U.S. Global Change Research Program), The impacts of climate change on human health in the United States: A scientific assessment (pp. 99–128).
3 NOAA (National Oceanic and Atmospheric Administration). (2012). Personal communication: Analysis by Derek Arndt, April 2012. National Climatic Data Center.
4 NOAA (National Oceanic and Atmospheric Administration). (2024). U.S. Climate Extremes Index. Retrieved April 18, 2024, from www.ncei.noaa.gov/access/monitoring/cei
5 NOAA (National Oceanic and Atmospheric Administration). (2024). Standardized Precipitation Index data files [Data set]. Retrieved April 18, 2024, from www.ncei.noaa.gov/pub/data/cirs/climdiv
Learn about other indicators in this section