Climate Change Indicators: Leaf and Bloom Dates
This indicator examines the timing of leaf growth and flower blooms for two widely distributed plants in the United States.
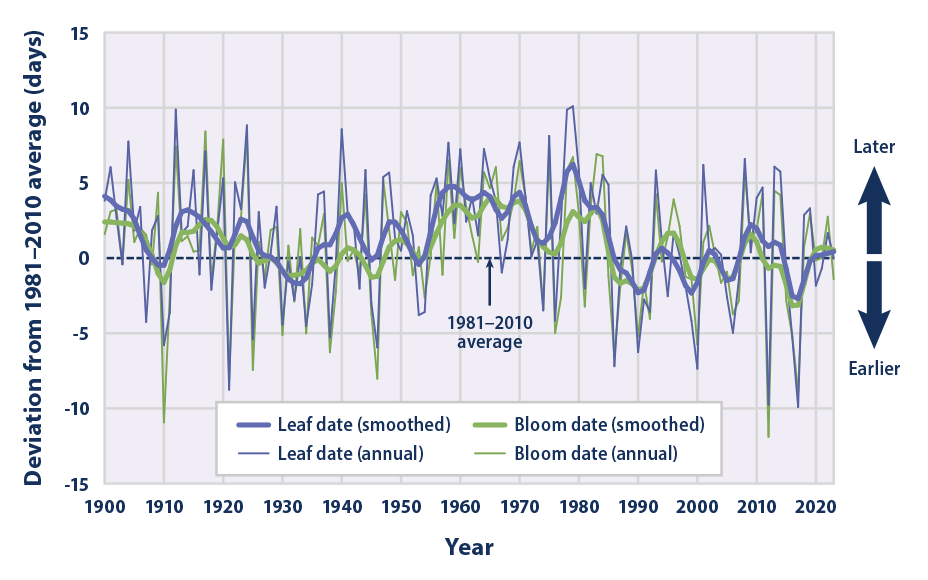
This figure shows modeled trends in lilac and honeysuckle first leaf dates and first bloom dates across the contiguous 48 states, using the 1981 to 2010 average as a baseline. Positive values indicate that leaf growth and blooming began later in the year, and negative values indicate that leafing and blooming occurred earlier. The thicker lines were smoothed using a nine-year weighted average. Choosing a different long-term average for comparison would not change the shape of the data over time.
Data source: 2024 update by M. Schwartz to data from Schwartz et al., 20133
Web update: June 2024
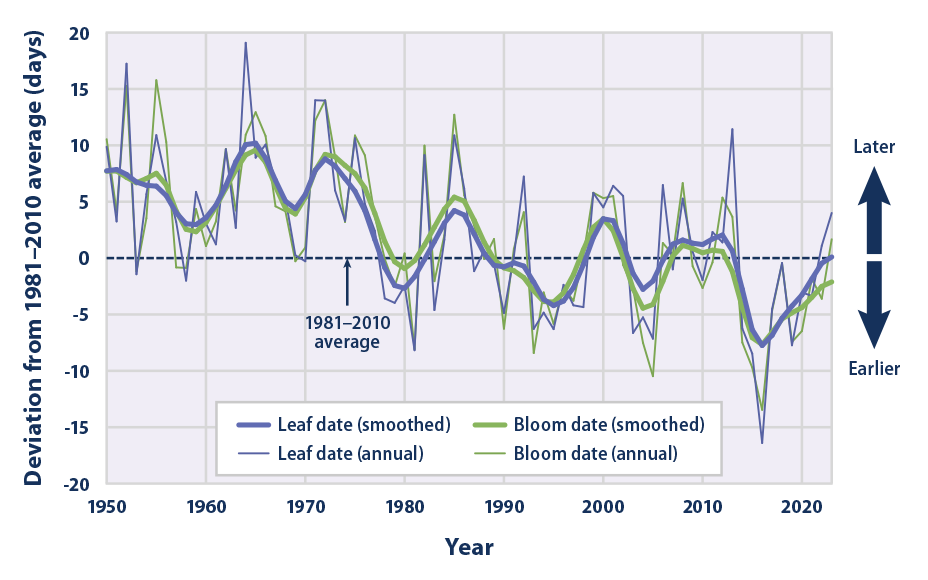
This figure shows modeled trends in lilac and honeysuckle first leaf dates and first bloom dates across Alaska, using the 1981 to 2010 average as a baseline. Positive values indicate that leaf growth and blooming began later in the year, and negative values indicate that leafing and blooming occurred earlier. The thicker lines were smoothed using a nine-year weighted average. Choosing a different long-term average for comparison would not change the shape of the data over time.
Data source: 2024 update by M. Schwartz to data from Schwartz et al., 20133
Web update: June 2024
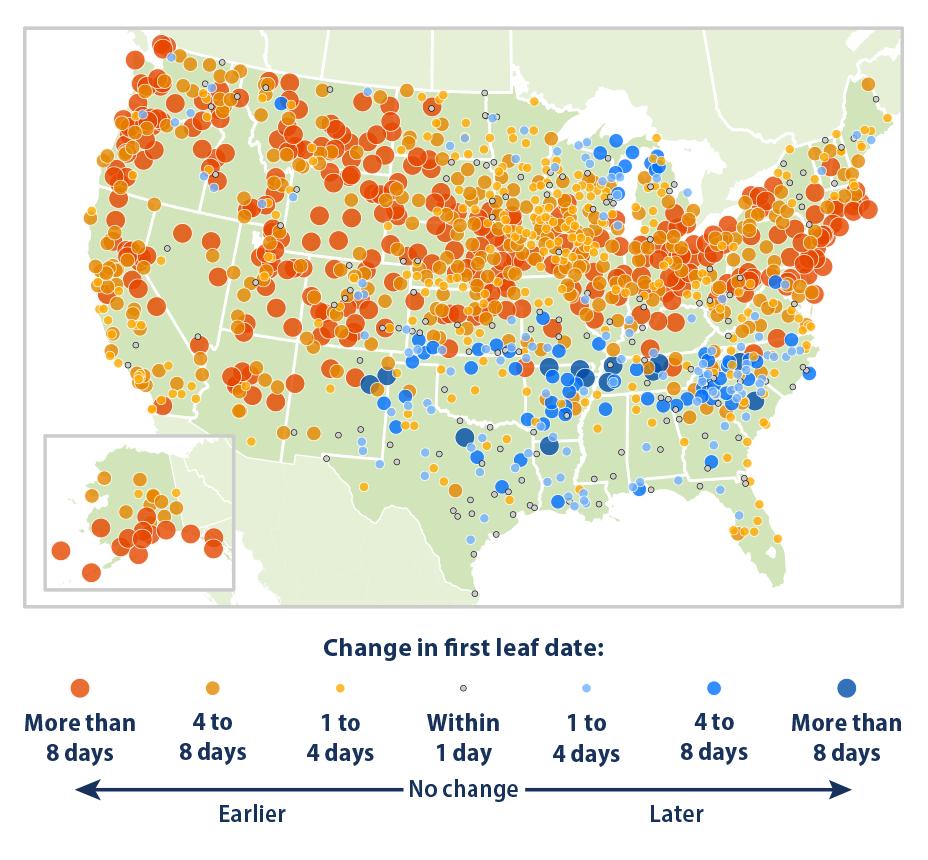
This figure shows modeled trends in lilac and honeysuckle first leaf dates at weather stations across the contiguous 48 states and Alaska. This map compares the average first leaf date for two 10-year periods.
Data source: 2024 update by M. Schwartz to data from Schwartz et al., 20133
Web update: June 2024
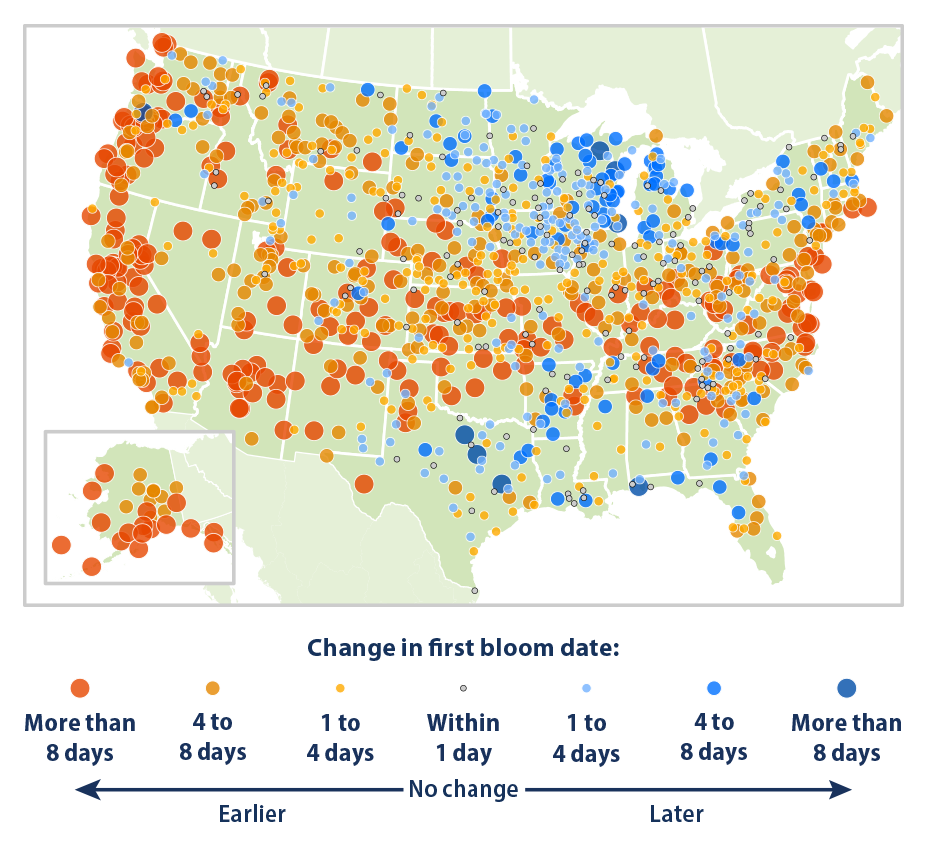
This figure shows modeled trends in lilac and honeysuckle first bloom dates at weather stations across the contiguous 48 states and Alaska. This map compares the average first bloom date for two 10-year periods.
Data source: 2024 update by M. Schwartz to data from Schwartz et al., 20133
Web update: June 2024
Key Points
- First leaf and bloom dates in lilacs and honeysuckles in the contiguous 48 states show a great deal of year-to-year variability, which makes it difficult to determine whether a statistically meaningful change has taken place. In the last few decades, however, earlier start dates for these springtime events appear more prevalent (Figure 1).
- While first leaf and bloom dates in Alaska show a great deal of year-to-year variability, start dates for these springtime events appear to be trending earlier over the last few decades (Figure 2). This change is statistically significant.
- In general, leaf and bloom events are happening earlier throughout most of the contiguous 48 states and in Alaska but later in much of the South and part of the Upper Midwest (Figures 3 and 4). This observation is consistent with many of the regional differences in temperature change shown by the U.S. and Global Temperature indicator.
- The patterns in this indicator are consistent with those found in other studies. For example, a study of vegetation in U.S. national parks also noted earlier leaf and bloom dates in Alaska and the northern and western portions of the contiguous 48 states.4 Other studies (e.g., Schwartz et al., 20062) have looked at trends in leaf and bloom dates across all of North America and the entire Northern Hemisphere. These studies have also found a trend toward earlier spring events—some more pronounced than the trends seen in just the contiguous 48 states.
Background
The timing of natural events, such as flower blooms and animal migration, is influenced by a combination of environmental factors, including temperature, light, rainfall, and humidity. Phenology is the study of such important seasonal events. Phenological events are influenced by a combination of environmental factors, including temperature, light, rainfall, and humidity. Different plant and animal species respond to different cues.
Scientists have very high confidence that the earlier arrival of spring events is linked to recent warming trends in global climate.1 Disruptions in the timing of these events can have a variety of impacts on ecosystems and human society. For example, an earlier spring might lead to longer growing seasons (see the Length of Growing Season indicator), more abundant invasive species and pests, and earlier and longer allergy seasons (see the Ragweed Pollen Season indicator). Unusually warm weather in late winter can create a “false spring” that triggers the new growth of plants to begin too early, leaving them vulnerable to any subsequent frosts.
Because of their close connection with climate, the timing of phenological events can be used as an indicator of the sensitivity of ecological processes to climate change. Two particularly useful indicators of the timing of spring events are the first leaf dates and the first bloom dates of lilacs and honeysuckles, which have an easily monitored flowering season, a relatively high survival rate, and a large geographic distribution. The first leaf date in these plants relates to the timing of events that occur in early spring, while the first bloom date is consistent with the timing of later spring events, such as the start of growth in forest vegetation.2
About the Indicator
This indicator shows trends in the timing of first leaf dates and first bloom dates in lilacs and honeysuckles across the contiguous 48 states and Alaska. Because many of the phenological observation records in the United States are less than 40 years long, and because these records may have gaps in time or space, computer models have been used to provide a more complete understanding of long-term trends nationwide.
The models for this indicator were developed using data from the USA National Phenology Network, which collects ground observations from a network of federal agencies, field stations, educational institutions, and citizens who have been trained to log observations of leaf and bloom dates. For consistency, observations were limited to a few specific types of lilacs and honeysuckles. Next, models were created to relate actual leaf and bloom observations with records from nearby weather stations. Once scientists were able to determine the relationship between climate factors (particularly temperatures) and leaf and bloom dates, they used this knowledge to estimate leaf and bloom dates for earlier years based on historical weather records. They also used the models to estimate how leaf and bloom dates would have changed in a few areas (mostly the warmest parts of the South and West and the coldest parts of Alaska) where lilacs and honeysuckles are not widespread.
This indicator uses data from nearly 3,000 weather stations throughout the contiguous 48 states and Alaska. The exact number of stations varies from year to year. For each year, the timing of first leaf and first bloom at each station was compared with the 1981 to 2010 average to determine the number of days’ “deviation from normal.” This indicator presents the average deviation across all stations, along with maps that compare the most recent 10-year period (2014–2023) with a mid-20th-century baseline (1951–1960) at individual stations. These time periods were chosen to match published studies.3
About the Data
Indicator Notes
Plant phenological events are studied using several data collection methods, including satellite images, models, and direct observations. The use of different data collection methods and different phenological indicators (such as leaf or bloom dates for different types of plants) can lead to a range of estimates of the arrival of spring.
Climate is not the only factor that can affect phenology. Observed variations can also reflect plant genetics, changes in the surrounding ecosystem, and other factors. This indicator minimizes the influence of genetic variations by relying on cloned plants, which have no genetic differences.
Data Sources
Leaf and bloom observations were compiled by the USA National Phenology Network and are available at: www.usanpn.org. This indicator is also based on temperature data from the National Oceanic and Atmospheric Administration’s National Centers for Environmental Information, which maintains a large collection of climate data online at: www.ncei.noaa.gov. Data for this indicator were analyzed using methods described by Schwartz et al. (2013).3
Technical Documentation
References
1 IPCC (Intergovernmental Panel on Climate Change). (2022). Climate change 2022—Impacts, adaptation and vulnerability: Working Group II contribution to the Sixth Assessment Report of the Intergovernmental Panel on Climate Change (H.-O. Pörtner, D. C. Roberts, M. Tignor, E. S. Poloczanska, K. Mintenbeck, A. Alegría, M. Craig, S. Langsdorf, S. Löschke, V. Möller, A. Okem, & B. Rama, Eds.). Cambridge University Press. https://doi.org/10.1017/9781009325844
2 Schwartz, M. D., Ahas, R., & Aasa, A. (2006). Onset of spring starting earlier across the Northern Hemisphere. Global Change Biology, 12(2), 343–351. https://doi.org/10.1111/j.1365-2486.2005.01097.x
3 Schwartz, M. D., Ault, T. R., & Betancourt, J. L. (2013). Spring onset variations and trends in the continental United States: Past and regional assessment using temperature-based indices. International Journal of Climatology, 33(13), 2917–2922. https://doi.org/10.1002/joc.3625
4 Monahan, W. B., Rosemartin, A., Gerst, K. L., Fisichelli, N. A., Ault, T., Schwartz, M. D., Gross, J. E., & Weltzin, J. F. (2016). Climate change is advancing spring onset across the U.S. national park system. Ecosphere, 7(10), e01465. https://doi.org/10.1002/ecs2.1465
Learn about other indicators in this section