
Winner of the Water Toxicity Sensor Challenge – Phase 2
- Challenge Description
- Challenge Winner and Honorable Mention
- Evaluation Criteria
- Challenge Partners for Phase 2
Challenge Description
To help meet the need for better ways to monitor toxicity in water, the US Environmental Protection Agency (EPA) and its Challenge partners launched the prototype portion of the Water Toxicity Sensor Challenge. The Partners include EPA, the United States Geological Survey (USGS), the National Oceanic and Atmospheric Administration (NOAA), the U.S. Army Medical Research and Development Command (USAMRDC), the Greater Cincinnati Water Works (GCWW), the Water Research Foundation (WRF), and the Water Environment Federation (WEF).
Background
Monitoring the increasing number of contaminants in water is an ongoing concern for water treatment systems and water resource managers. Pesticides, heavy metals, personal care products, natural toxins, and a host of other organic and inorganic chemical pollutants and their byproducts can increase toxicity in water and create exposure concerns for humans and aquatic organisms.
Current methods for detecting and identifying many of these contaminants are expensive, time-consuming, and may require the use of specialized laboratories and highly trained personnel. The numbers of sensors, instruments, tests, labs, personnel, and other costs can become an economic burden for water treatment system managers and water resource managers. If the identity of the potential contaminants is unknown, this process becomes even more complex and costly.
Because of these limitations, there is great interest in developing a next generation of sensors that detect the toxicity of water due to the presence of contaminants. Some chemicals can activate toxicity pathways inside living cells. This causes a disruption to normal biological processes, like breathing or digestion, which can lead to harmful health effects, including diseases like cancer. Motivating factors for this approach include:
- Public health protection: A toxicity-based sensor could quickly alert water managers to the presence of one or more contaminants that may have an adverse physiological effect, including contaminants that are not currently well characterized. It would also help address the need for managing groups of contaminants.
- Environmental water quality monitoring and forecasting: Portable, field deployable, effects-based monitoring would complement existing contaminant-based efforts and the data generated could enhance science-based decision support tools.
- Reduced need for animal toxicity testing: Robust toxicity sensors could reduce our dependency on some animal-based toxicity testing methods currently used in water management.
Challenge Winner & Honorable Mention
For this Challenge, solvers developed a prototype sensor and demonstrated its ability to detect a response to toxicity due to the presence of one or more contaminants at concentrations relevant to human health effects. The prototype sensor aimed to detect toxicity faster and cheaper than current methods. In this challenge, the words “prototype” and "sensor” interchangeably refer to the prototype sensor.
The solvers submitted written solutions for review and evaluation by the Challenge Committee. The Committee then selected finalists based on the evaluation criteria detailed below. Finalists were then required to submit their prototypes to an approved third party for evaluation in order to be considered for the final prize. Based on the review of the data obtained from the third party for each finalist, the Committee selected a winner. The prize for this Challenge was $105,000 US dollars.
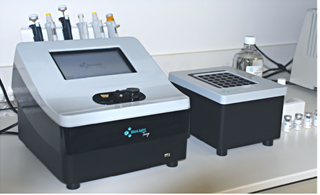
Winner: BioLight Toxy
The BioLight Toxy has emerged as the champion with their groundbreaking solution. Their creativity, innovation, and quantitative results for multiple test toxins set them apart. We commend their exceptional work and look forward to seeing their impact in the field of water toxicity sensors.
The BioLight Toxy system, which can be used in the field or the laboratory, is based on a detection mechanism using Aliivibrio fischeri, a bioluminescent microbe. Water samples are mixed with a proprietary solution containing the bacteria. The presence of toxicity reduces the level of fluorescence, which is read by a sensor which is a luminometer with advanced user interface. The system can run multiple samples and calculate results using EC50 (effective concentration 50%). This system indicated quantitative toxicity in samples containing zinc and 3,5-dichlorophenol and showed some response to lead (Pb) and microcystin LR, a toxin produced by cyanobacteria.

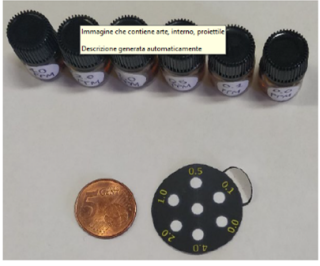
Honorable Mention: SCENTINEL
We also recognize SCENTINEL for their remarkable contribution. Their solution demonstrated ingenuity and promise, making them a standout participant.
The SCENTINEL system was one of the winners of Phase 1 of the Water Toxicity Sensor Challenge, where ideas and concepts of water toxicity sensors were evaluated. In Phase 2, an updated version of the prototype was evaluated to be a low-cost and highly portable system. The SCENTINEL system uses a paper sensor containing the bioluminescent bacteria Aliivibrio fischeri. Water samples are added to wells in the paper sensor and bioluminescence emitted can be captured by a smartphone. Semi-quantitative readings can be taken by analyzing the intensity of the luminescence of the wells. This system measured a quantitative toxic response to bleach and a semiquantitative response to 3, 5 -dichlorophenol. Some response to lead (Pb) and microcystin LR was also seen.

Thank you to all participants, judges, and sponsors for making Phase 2 of the Water Toxicity Sensor Challenge a success!
Phase 2 Evaluation Criteria
Sensor Considerations:
- Sensor Capability: The prototype should be field deployable and capable of detecting the activation of one or more toxic pathways in the presence of various harmful chemicals and natural toxins in multiple water matrices. The sensor needs to indicate the presence of toxicity but does not need to identify specific contaminants.
- Measurements: The solver may select the reference contaminant(s) to use for sensor prototype demonstration. Reference contaminant(s) should be used at levels relevant to human health effects. For some contaminants, EPA action levels (EPA National Primary Drinking Water Regulations, EPA Human Health Criteria Table, etc) can provide a guide to the level of sensitivity needed.
- Data Transmission and Storage: The sensor should be capable of reporting and recording data on key parameters of interest at a regular interval.
- Operability: The sensor should require minimal infrastructure and operator effort to set-up, operate, and decommission.
- Safety: The system should be designed to minimize any hazard to people, especially if exposed to water.
- Technical Readiness Level: The prototype should be ready for validation and demonstration, equivalent to a Technical Readiness Level (TRL) of 5-6. See the Technology Assessment Readiness Guide (Government Accountability Office) for details.
Things to Avoid
- A sensor that measures only basic water quality parameters such as pH, turbidity, nutrients, or conductivity.
- A sensor that is designed to detect a specific contaminant as opposed to the presence of toxicity.
- Theoretical sensors- only physical, functional prototypes will be considered, not prototype designs.
- Difficult-to-operate sensors-it should be possible for a third party to independently operate the working prototype and understand data outputs without significant interaction with the solver.
Submissions:
Judges reviewed sensor submissions before any third-party evaluation, following the requirements described below:
Narrative
A description (limited to five pages) of the prototype sensor, including the system features listed below.
System Features
- Type of system: For example, is the prototype an in-line, in situ, or stand-alone system?
- Automated system: Are any parts of the prototype sensor automated?
- Measurement theory: What are the elements in the prototype that support toxicity assessment? How are the signals detected, amplified, and digitized?
- Use case scenario: How can this prototype be marketed? Who are the target users of this sensor?
- Cost estimate: A cost estimate ($US) should be provided for the following: 1) the purchase price if commercialized; 2) the cost per sample; and 3) the cost of annual maintenance, including component replacement.
- Operating Temperature Range: (°C) What external temperature range is required for reliable operation of the sensor? Is the sensor output adjusted automatically for any changes in sensitivity across the operational temperature range?
- Number of samples: Can a single sensor evaluate multiple samples simultaneously? Can multiple detectors (as part of a single prototype device) be connected and run simultaneously?
- Life expectancy: What is the anticipated replacement cycle for overall system and components?
- Operations and maintenance: Activity descriptions and frequency of maintenance should be described.
- Calibration: Are additional costs incurred for calibration? At what frequency is calibration required? Are there editing/review capabilities? Are there notifications for drift or calibration issues? Is the use of internal ‘on-the-fly’ calibrants possible?
- Time for sensor sample analysis: Describe from sample collection to data generation.
- Sample Preparation Requirements/Methods: Does the prototype include volume of original sample, buffer or solvent used for sample analysis, sample analyzed, flow rate, etc.? What is the sample loading interval?
- Sensor disposal considerations: How is waste managed? Are toxic compounds produced?
- Data reporting interval: Please describe in minutes or hours.
- Data storage requirements: Cloud-based, instrument-linked, and/or portable storage device?
- Data collection format: Type of database file.
- Data transmission format: Data logger? Other (e.g., radio or cell phone modem, satellite uplink, etc.)?
- Sensor size: Weight and dimensions
- Power requirements: Is shore power required? Can unit be operated on battery power and for what length of time prior to recharging? Can solar power be used as the sole or supplemental power source? Is the sensor battery-powered, chargeable, requires AC/DC power, etc?
- Safety: The solver should provide a description of potential human safety risks for their prototype and any mitigation steps.
Standard Operating Procedure
A brief standard operating procedure must be provided.
Video
Provide a URL to an unlisted YouTube video (up to 5 min long) showing the operation of the sensor for one sample cycle. Also include a photograph of the whole sensor prototype.
Calibration and Testing
- A baseline calibration curve that displays detection vs. concentrations of a selected reference material (diluted in an appropriate solution or buffer fully compatible with the test). The graph should include concentrations that encompass the linear dynamic range.
- Test Results:
Solvers must evaluate their prototype for two different water matrices:- Finished drinking water – Drinking water from a treatment plant, distribution system, or tap that is designed for human consumption.
- Surface water (or similar matrix) – Water from a lake, river, or other natural source with higher turbidity and organic load than finished drinking water.
Describe the matrices in the following table: Water Matrix Table (pdf)Water Matrix Parameter (units) Drinking Water Matrix Surface Water (Or Similar Matrix) Describe Matrix pH (s.u.) Disinfectant Residual (Indicate the residual and units being reported) Turbidity (NTU) Temperature (°C) Hardness (mg/L as CaCO3) Total Organic Carbon (mg/L) Alkalinity as CaCO3 (mg/L) Conductivity (μS/cm or mS/cm)
- For each matrix, produce a reproducible matrix-matched curve showing the effectiveness of the prototype in detecting a range of concentrations of the contaminant reference material (concentrations should be relevant to human health effects as described in the Measurements section above). Provide graphs of detection vs. concentration and indicate the number of replicates per concentration.
Include the lower limit of detection, defined as the smallest amount or concentration of the analyte in the test sample that can be reliably distinguished from zero. In general, this is calculated by using the following equation.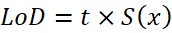
- Using the drinking water matrix, provide the information outlined in the Performance Metrics Table below, using 10 replicates, for the following three concentrations of the reference contaminant:
- A human physiological relevant level
- A concentration near the lower end of the dynamic range
- A concentration at the middle of the dynamic range
For each, provide the raw data supporting these responses. Use the drinking water matrix sample without addition of the reference contaminant as a negative control.
Performance Metrics Table
Description of how each performance metric is calculated or determined in the drinking water matrix.
NOTE: Please provide as much detail and data as possible when describing how each performance metric was calculated or determined in each water matrix. In the responses, please provide details of how the metric was calculated. Include an explanation if a metric cannot be calculated or if you calculated a metric differently (e.g., the prototype is qualitative and/or produces binary responses). Qualitative/binary responses are equally valid to quantitative ones, as this challenge is meant to detect the presence of toxicity rather than specific contaminants.
| Performance Metric | Response (Assessment of Metric) |
|---|---|
| Accuracy |
Accuracy is the overall magnitude of known systematic (determinate) errors associated with the use of an analytical method. In general, this is calculated by using the following equation: Accuracy = 100% - Error Rate where Error Rate = [Observed Value – Actual Value]/Actual Value x 100 |
| Precision |
Precision characterizes the closeness of agreement between the measured values obtained by the replicate measurements on the same or similar objects under specified conditions. In general, this is calculated by using the following equation: 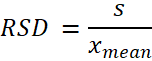
where s is: 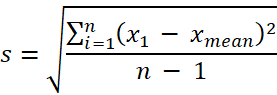
where RSD is relative standard deviation; s is the standard deviation; n is the number of measurements made; x1 is each measurement result; xmean is the mean value of the measurement results. |
| False Positive Rate |
The probability that a positive result will be given when the true value is negative. In general, this is calculated by using the following equation: 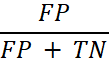
where FP is the number of false positives and TN is the number of true negatives (FP + TN being the total number of negatives). |
| False Negative Rate |
The probability that a true positive will be missed by the test. In general, this is calculated by using the following equation: 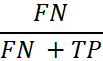
where FN is the number of false negatives and TP is the number of true positives (FN+TP being the total number of positives). |
| Sensitivity (True Positive Rate) |
The probability of a positive test result, conditioned on the sample truly being positive. In general, this is calculated by using the following equation: 
where TP is true positive, and FN is false negative. |
| Specificity (True Negative Rate) |
The probability of a negative test result, conditioned on the sample truly being negative. In general, this is calculated by using the following equation: 
where TN is true negative, and FP is false positives. |
Challenge Partners for Phase 2
The Water Toxicity Sensor Phase 2 Challenge is a collaborative effort of the U.S. Environmental Protection Agency, the United States Geological Survey (USGS), the National Oceanic and Atmospheric Administration (NOAA), the U.S. Army Medical Research and Development Command (USAMRDC), the Greater Cincinnati Water Works (GCWW), the Water Research Foundation (WRF) and the Water Environment Federation (WEF).