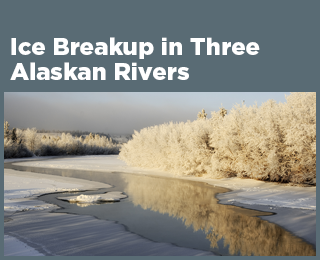
Community Connection: Ice Breakup in Three Alaskan Rivers
This feature examines the timing of spring river ice breakup in three communities that have kept detailed records for more than 100 years.
 This figure shows the date each year when ice breaks up at three locations: the town of Nenana on the Tanana River, Dawson City on the Yukon River, and Bethel on the Kuskokwim River. The annual data for each river have been plotted using a nine-year moving average.
Key Points
- The Tanana, Yukon, and Kuskokwim rivers all demonstrate long-term trends toward earlier ice breakup in the spring. The ice breakup dates for all three rivers have shifted earlier by seven to nine days over their respective periods of record.
- At all three locations, the earliest breakup dates on record have occurred within the past six years.
- Despite the overall trend toward earlier breakup, most of the recent breakup dates for the rivers are within the range of historical variation.
Background
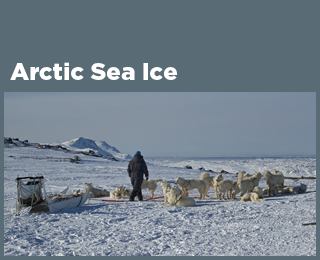
Regions in the far north such as Alaska are warming more quickly than other parts of the world, and this pattern is expected to continue1,2 (see the Arctic Sea Ice indicator; for more information about regional temperature changes, see the U.S. and Global Temperature indicator). The Tanana, Yukon, and Kuskokwim rivers in Alaska provide a particularly noteworthy record of northern climate. For a century or more, local citizens have recorded the date when the ice on these rivers starts to move or break up each spring. In fact, some towns have annual competitions to guess when ice breakup will occur.
Since 1917, the Nenana Ice Classic competition on the Tanana River in central Alaska has paid several million dollars in winnings to the people who come closest to guessing the exact date and time of day when the river ice will break up. Similar traditions exist on the Kuskokwim River in Bethel, where breakup dates have been recorded since 1924, and in Dawson City on the Yukon River, just across the border in Canada, where breakup dates have been recorded since 1896.
River ice breakup is more than just a friendly competition, though. Ice breakup is an important time of transition for communities that rely on these relatively remote and free-flowing wild rivers for transportation, subsistence hunting and fishing, and other needs. In addition, early thawing can lead to severe ice movement, jamming, damage to infrastructure, and destructive floods.3
The data collected by these communities highlight how the river ice breakup dates in Nenana, Dawson City, and Bethel have changed over time. The towns all use the same method to measure the date and time of river ice breakup. Residents place a tripod on the ice in the center of the river. This tripod is attached by a cable to a clock on the shore. When the ice under the tripod breaks or starts to move, the tripod moves, pulling the cable and stopping the clock.
For this and other examples of community connections to observed climate-related changes, see the StoryMap at: https://storymaps.arcgis.com/stories/ebd8dcbb0b6048cd81caa6eb450b8974.
About the Data
Notes
Besides climate change, natural year-to-year variations and other factors, such as local development and land-use patterns, can influence ice breakup dates. The three locations featured here are relatively remote and undeveloped, so the ice breakup dates are more likely to reflect natural changes in weather and climate conditions. However, corresponding measurements of water conditions and air temperature are useful to help understand the connection between changes in river ice breakup and changes in climate. A recent comparison with satellite measurements of freeze/thaw conditions at ground level (basically a way of measuring surface temperature) showed a close correlation between regional temperature conditions and actual Tanana River breakup dates.8
Data Sources
Ice breakup dates for the Tanana River at Nenana, the Yukon River at Dawson City, and the Kuskokwim River at Bethel have been recorded and made publicly available as part of three long-running community competitions: the Nenana Ice Classic, the Yukon River Breakup, and the Kuskokwim Ice Classic. The data shown here and other information can be found online at: https://www.nenanaakiceclassic.com, https://nsidc.org/data/nsidc-0064/versions/2, www.yukonriverbreakup.com/statistics, http://iceclassic.org/historical-data, and additional sources linked from these websites. Ice breakup dates for these rivers are also archived by the National Snow and Ice Data Center at: https://nsidc.org/data/g01377/versions/1 and the National Weather Service at: www.weather.gov/aprfc/breakupDB.
Technical Documentation
References
1 Marvel, K., Su, W., Delgado, R., Aarons, S., Chatterjee, A., Garcia, M. E., Hausfather, Z., Hayhoe, K., Hence, D. A., Jewett, E. B., Robel, A., Singh, D., Tripati, A., & Vose, R. S. (2023). Chapter 2: Climate trends. In USGCRP (U.S. Global Change Research Program), Fifth National Climate Assessment. https://doi.org/10.7930/NCA5.2023.CH2
2 IPCC (Intergovernmental Panel on Climate Change). (2021). Climate change 2021—The physical science basis: Working Group I contribution to the Sixth Assessment Report of the Intergovernmental Panel on Climate Change (V. Masson-Delmotte, P. Zhai, A. Pirani, S. L. Connors, C. Péan, S. Berger, N. Caud, Y. Chen, L. Goldfarb, M. I. Gomis, M. Huang, K. Leitzell, E. Lonnoy, J. B. R. Matthews, T. K. Maycock, T. Waterfield, O. Yelekçi, R. Yu, & B. Zhou, Eds.). Cambridge University Press. https://doi.org/10.1017/9781009157896
3 Beltaos, S., & Burrell, B. C. (2003). Climatic change and river ice breakup. Canadian Journal of Civil Engineering, 30(1), 145–155. https://doi.org/10.1139/l02-042
4 NSIDC (National Snow and Ice Data Center). (2024). Nenana Ice Classic: Tanana river ice annual breakup dates (NSIDC-0064; Version 2) [Data set]. NASA National Snow and Ice Data Center Distributed Active Archive Center. Retrieved November 15, 2024, from https://doi.org/10.5067/CAQ58H42LQY2
5 Yukon River Breakup. (2024). Yukon River breakup. Retrieved November 15, 2024, from https://yukonriverbreakup.com
6 Kuskokwim Ice Classic. (2024). Kuskokwim Ice Classic. Retrieved November 15, 2024, from http://iceclassic.org
7 National Weather Service. (2024). Alaska-Pacific River Forecast Center: Break up database. Retrieved November 15, 2024, from www.weather.gov/aprfc/breakupDB
8 Kim, Y., Kimball, J. S., Glassy, J., & Du, J. (2017). An extended global Earth system data record on daily landscape freeze–thaw status determined from satellite passive microwave remote sensing. Earth System Science Data, 9(1), 133–147. https://doi.org/10.5194/essd-9-133-2017
Learn about other indicators in this section