
Economic Impacts of Superfund Site Redevelopment
For over four decades, EPA’s Superfund program and its partners have cleaned up contaminated hazardous waste sites and supported local reuse efforts. Communities reuse Superfund sites in many ways – they host parks, shopping centers, sports fields, wildlife sanctuaries, manufacturing facilities, homes, utilities and energy facilities, roads and more.
The cleanup and reuse of Superfund sites restores value to site properties and communities affected by contamination. Many reuses help revitalize neighborhoods and downtowns. Site redevelopment can invigorate local economies with jobs, new businesses, tax revenues and spending. EPA also works to make sure that businesses can remain open and operate safely during Superfund cleanups, ensuring they continue to provide jobs and income for communities.
- National Economic Impacts and Beneficial Effects
- Economic Impacts by Region and State
- Superfund Site Reuse Examples and Beneficial Effects Economic Case Studies
- Information about Site-Specific Economic Highlights
National Economic Impacts and Beneficial Effects
SRP measures the beneficial economic effects of reuse at Superfund sites, collecting a range of information. SRP tracks these figures from year to year, providing a general overview of the impacts and beneficial effects associated with Superfund redevelopment nationwide:
- Number of businesses located on-site.
- Number of people employed at site businesses.
- Annual employment income from on-site jobs.
- Annual sales revenue generated by businesses on-site.
- On-site property value and property tax information.
- Other economic impacts that are unique to individual sites.
Businesses and organizations reuse Superfund sites for a variety of purposes. Some uses play a role in economically revitalizing communities. EPA has estimated the national economic beneficial effects of Superfund sites in reuse each year from 2011 through 2025.
In 2025, 739 Superfund sites had economic data available, representing only a percentage of all sites in reuse and excluding federal facilities. The remaining non-federal facility sites in reuse and continued use are not expected to have uses that support on-site businesses, provide jobs or generate sales revenue.
In 2025, EPA had economic data for 10,810 businesses. These businesses generate $69.7 billion in sales revenue and employ 233,901 people who earn a combined estimated annual income of $20.7 billion.
| Estimates of National Beneficial Effects Since 2011 | |||||
|---|---|---|---|---|---|
| Year | Sites in Reuse with Economic Data | Number of Businesses | Annual Sales* | Jobs | Annual Employment Income* |
| 2011 | 135 | 271 | $12.6 billion | 24,308 | $2.3 billion |
| 2012 | 276 | 972 | $28.0 billion | 46,475 | $4.6 billion |
| 2013 | 363 | 2,216 | $45.1 billion | 70,270 | $6.7 billion |
| 2014 | 450 | 3,474 | $42.8 billion | 89,646 | $8.2 billion |
| 2015 | 454 | 3,908 | $39.4 billion | 108,445 | $10.6 billion |
| 2016 | 458 | 4,720 | $45.6 billion | 131,635 | $12.3 billion |
| 2017 | 487 | 6,622 | $57.3 billion | 156,352 | $14.7 billion |
| 2018 | 529 | 8,690 | $67.2 billion | 195,465 | $17.1 billion |
| 2019 | 602 | 9,188 | $73.4 billion | 208,468 | $18.1 billion |
| 2020 | 632 | 9,902 | $78.7 billion | 227,769 | $20.2 billion |
| 2021 | 650 | 10,230 | $78.2 billion | 246,178 | $22.0 billion |
| 2022 | 671 | 10,253 | $81.6 billion | 236,802 | $20.4 billion |
| 2023 | 692 | 10,261 | $75.5 billion | 237,054 | $19.9 billion |
| 2024 | 718 | 10,622 | $73.7 billion | 242,187 | $20.8 billion |
| 2025 | 739 | 10,810 | $69.7 billion | 233,901 | $20.7 billion |
| *Adjusted to 2025 U.S. dollars (USD) using the Consumer Price Index (CUUR0000SA0, not seasonally adjusted, U.S. city annual average). | |||||
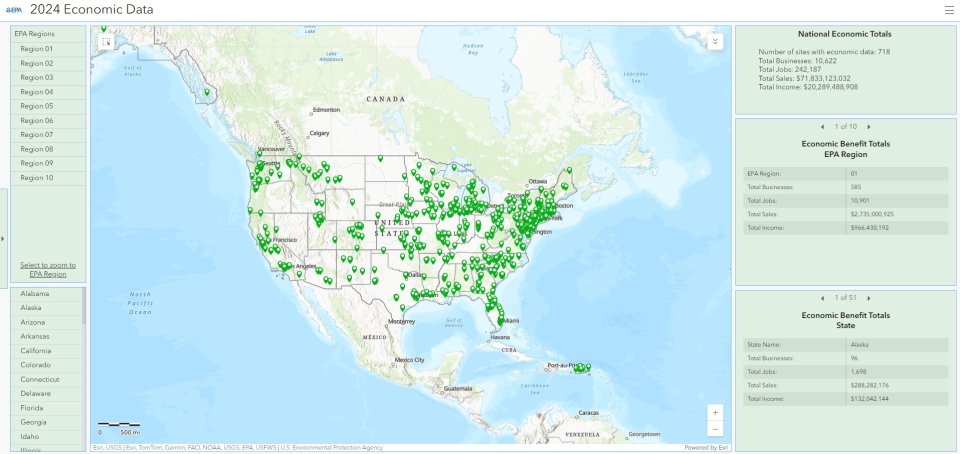
Redevelopment Economics at Superfund Sites: 2024 Beneficial Effects StoryMap
This StoryMap highlights the national economic benefits associated with Superfund site reuse. It also discusses the different ways that EPA shares that information with the public:
Superfund Redevelopment Economics Notebook (pdf) 609 KB
SRP’s Superfund Redevelopment Economics Notebook provides a general overview of EPA’s efforts to quantify some of the economic benefits associated with the cleanup and reuse of Superfund sites.
Challenges in Applying Property Value Studies to Assess the Benefits of the Superfund Program (pdf) 430 KB
Jobs are not the only way communities benefit when Superfund sites are cleaned up. This 2009 report provides an overview of how cleaning up sites may benefit home prices.
Economic Impacts by Region and State
Regional Economic Profiles
Putting Sites to Work – How Superfund Redevelopment is Making a Difference in Communities Across the United States: Compendium of 2024 Economic Data
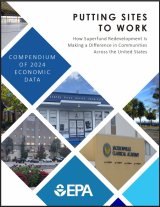
SRP's Compendium of 2024 Economic Data highlights and summarizes the economic benefits associated with the cleanup and reuse of Superfund sites nationally and at EPA Region and state level.
Read the Report (pdf) (17.7 MB)
SRP develops regional economic profiles that highlight the role of Superfund in each EPA Region and the beneficial effects of reusing formerly contaminated properties. These reports summarize economic data collected for Superfund sites within an EPA Region. They also highlight successes and put them in the context of aggregated data within the state and EPA Region.
EPA Region 1 (Connecticut, Maine, Massachusetts, New Hampshire, Rhode Island, Vermont)
EPA Region 2 (New Jersey, New York, Puerto Rico, U.S. Virgin Islands)
EPA Region 3 (Delaware, Maryland, Pennsylvania, Virginia, West Virginia)
EPA Region 4 (Alabama, Florida, Georgia, Kentucky, Mississippi, North Carolina, South Carolina, Tennessee)
EPA Region 5 (Illinois, Indiana, Michigan, Minnesota, Ohio, Wisconsin)
EPA Region 6 (Arkansas, Louisiana, New Mexico, Oklahoma, Texas)
EPA Region 7 (Iowa, Kansas, Missouri, Nebraska)
EPA Region 8 (Colorado, Montana, North Dakota, South Dakota, Utah, Wyoming)
EPA Region 9 (Arizona, California, Hawaii, Nevada, American Samoa, Guam)
EPA Region 10 (Alaska, Idaho, Oregon, Washington)
Superfund Site Reuse Examples and Beneficial Effects Economic Case Studies

Superfund Site Reuse Successes:
- Blackburn & Union Privileges – Walpole, Massachusetts (EPA Region 1)
- Former Nansemond Ordnance Depot – Suffolk, Virginia (EPA Region 3)
- Kansas City Structural Steel – Kansas City, Kansas (EPA Region 7)
- Kennecott (South Zone) – Bingham Canyon, Utah (EPA Region 8)
- Murray Smelter – Murray City, Utah (EPA Region 8)
- PJP Landfill – Jersey City, New Jersey (EPA Region 2)
- Reilly Tar & Chemical Corp. (Indianapolis Plant) – Indianapolis, Indiana (EPA Region 5)
- Reynolds Metals Company – Troutdale, Oregon (EPA Region 10)
- RSR Corporation – Dallas, Texas (EPA Region 6)
- South Bay Asbestos Area – Alviso, California (EPA Region 9)
Beneficial Effects Economic Case Studies
These case studies gather more complete information related to reuse, employment and other beneficial effects. While national impact estimates may underestimate jobs, a local beneficial effects case study obtains detailed information about economic benefits for every company present at a site, in addition to unique economic benefits provided by particular uses, such as alternative energy.
Each beneficial effects economic case study includes a technical appendix that provides an overview of the approaches, assumptions and methodologies used to obtain estimates of local beneficial effects.
Featured Case Studies
Beneficial Effects Economic Case Study: Former Nansemond Ordnance Depot Superfund Site – Suffolk, Virginia (EPA Region 3) (pdf) 13.6 MB
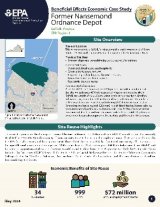
This SRP case study describes how extensive coordination among EPA, federal agencies and local governments made possible the successful cleanup of this former munitions area. Throughout the process, EPA facilitated community efforts advocating for equitable and protective redevelopment. Today, the area hosts more than 100 landowners and a wide range of new uses and forward-thinking businesses. They include the Sustainable Water Initiative for Tomorrow Research Center, the Ashely Capital Bridgeway Business Center, the Tidewater Community College Center for Workforce Solutions, the Lockheed Martin Center for Innovation, new residential uses and the award-winning RoadOne IntermodaLogistics facility.
Ecosystem Services at Superfund Sites: Reuse and Benefit to the Community (pdf) 31.1 MB
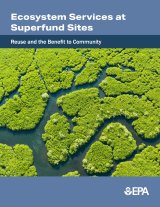
This SRP report provides more information about ecosystem services at Superfund sites and the positive impacts of these services at Superfund sites across the country.
Use the table below to search SRP’s beneficial effects economic case studies by site name, location and keyword.
| Site Name | State | Region | Year | Reuse Keywords |
|---|---|---|---|---|
| Abex Corp. (pdf) (386 KB) | VA | 3 | 2011 | recreational; commercial; industrial; public service |
| Aidex Corp. (pdf) (899 KB) | IA | 7 | 2015 | industrial |
| Airco Plating Co. (pdf) (1.04 MB) | FL | 4 | 2014 | industrial; groundwater; vapor intrusion |
| American Cyanamid Co (pdf) (3.2 MB) | NJ | 2 | 2018 | recreational; commercial; public service; energy; solar; ecological |
| Benfield Industries, Inc. (pdf) (747 KB) | NC | 4 | 2012 | commercial; industrial; ecological |
| Big River Mine Tailings/St. Joe Minerals Corp. (pdf) (12.4 MB) | MO | 7 | 2018 | residential; commercial; industrial; recreational; public service; agricultural; ecological; mine; mining |
| Blackburn & Union Privileges (pdf) (2.09 MB) | MA | 1 | 2019 | recreational; public service; residential; commercial |
| BMI-Textron and Trans Circuits, Inc. (pdf) (637 KB) | FL | 4 | 2014 | industrial; commercial |
| Boise Cascade/Onan Corp./Medtronics, Inc. (pdf) (1.52 MB) | MN | 5 | 2017 | ecological; commercial; industrial; wood-treating; vapor intrusion; energy; solar |
| Brown's Dump (pdf) (3.59 MB) | FL | 4 | 2022 | agricultural; public service; residential; commercial |
| Brunswick Naval Air Station (pdf) (3.71 MB) | ME | 1 | 2019 | recreational; ecological; commercial; industrial; public service; residential; military; energy; solar; biomass |
| Buckbee-Mears (pdf) (1.76 MB) | NY | 2 | 2023 | industrial; ecological |
| Bunker Hill Mining & Metallurgical Complex (pdf) (8.92 MB) | ID | 10 | 2017 | commercial; industrial; public service; residential; recreational; ecological; mine; mining; sediment; wetlands |
| Calhoun Park Area (pdf) (7.57 MB) | SC | 4 | 2020 | recreational; ecological; commercial; public service; residential; groundwater; sediment; capped |
| California Gulch (pdf) (1.18 MB) | CO | 8 | 2014 | recreational; ecological; residential; commercial; federal; mine; mining; sediment; capped |
| Cascade Park Gasification Plant (pdf) (3.55 MB) | FL | 4 | 2023 | commercial; recreational; ecological; residential; landfill; capped; dry cleaning |
| Cherokee County (pdf) (9.17 MB) | KS | 7 | 2020 | agricultural; recreational; ecological; commercial; public service; residential; industrial; mine; mining; tribal; energy |
| Coalinga Asbestos Mine (pdf) (1.27 MB) | CA | 9 | 2015 | commercial; residential; public service; industrial; mine; mining |
| Colorado Smelter (pdf) (3.81 MB) | CO | 8 | 2020 | residential |
| Davie Landfill (pdf) (4.09 MB) | FL | 4 | 2014 | recreational; ecological |
| Davisville Naval Construction Battalion Center (pdf) (4.37 MB) | RI | 1 | 2018 | recreational; ecological; commercial; industrial; public service; military; energy; solar; landfill; wetlands |
| Del Amo (pdf) (2.15 MB) | CA | 9 | 2013 | commercial; industrial; capped; vapor intrusion |
| Delaware City PVC Plant (pdf) (1.72 MB) | DE | 3 | 2022 | commercial; industrial |
| Denver Radium Site (pdf) (4.34 MB) | CO | 8 | 2019 | commercial; industrial; residential |
| E.I. du Pont de Nemours & Co., Inc. (Newport Pigment Plant Landfill) (pdf) (708 KB) | DE | 3 | 2014 | recreational; ecological; industrial; energy; solar; landfill |
| Eastland Woolen Mill (pdf) (1.98 MB) | ME | 1 | 2019 | recreational; ecological; commercial; public service; residential; groundwater |
| Ecosystem Services at Superfund Sites (pdf) (2.2 MB) | Multiple | Multiple | 2017 | recreational; ecological; agricultural; groundwater; tribal; wetlands |
| Ecosystem Services at Superfund Sites (pdf) (30.9 MB) | Multiple | Multiple | 2023 | recreational; ecological; agricultural; commercial; military; solar; wind; biomass; geothermal; landfill gas; landfill; mine; mining; energy; capped; tribal |
| Flat Creek IMM (pdf) (2.77 MB) | MT | 8 | 2019 | residential; commercial; public service; recreational; mine; mining |
| FMC Corp. (Yakima) (pdf) (397 KB) | WA | 10 | 2014 | commercial; industrial |
| Former Nansemond Ordnance Depot (pdf) (13.6 MB) | VA | 3 | 2023 | commercial; industrial; residential; public service; military; ecological; solar; energy |
| Fort Devens (pdf) (1.64 MB) | MA | 1 | 2018 | recreational; ecological; commercial; industrial; residential; public service; military; federal |
| General Electric Co/Shepherd Farm (pdf) (1.05 MB) | NC | 4 | 2017 | recreational; commercial; industrial; residential; landfill; groundwater |
| General Mills/Henkel Corp. (pdf) (1.4 MB) | MN | 5 | 2014 | commercial; industrial; vapor intrusion |
| Goldisc Recordings, Inc. (pdf) (1.86 MB) | NY | 2 | 2015 | commercial; industrial; groundwater |
| Havertown PCP (pdf) (2.15 MB) | PA | 3 | 2017 | recreational; commercial; public service; wood-treating; groundwater; capped |
| Highway 71/72 Refinery (pdf) (2.25 MB) | LA | 6 | 2015 | commercial; residential; vapor intrusion |
| Industri-Plex (pdf) (1.91 MB) | MA | 1 | 2019 | ecological; commercial; industrial; public service |
| Iron Horse Park (pdf) (1.99 MB) | MA | 1 | 2017 | ecological; industrial; solar; landfill; energy; wetlands |
| Joslyn Manufacturing & Supply Co. (pdf) (670 KB) | MN | 5 | 2016 | commercial; industrial; wood-treating |
| Kansas City Structural Steel (pdf) (1.89 MB) | KS | 7 | 2015 | commercial; public service |
| Kearsarge Metallurgical Corp. (pdf) (2.04 MB) | NH | 1 | 2016 | commercial; ecological; groundwater |
| Kennecott (South Zone) (pdf) (4.81 MB) | UT | 8 | 2017 | commercial; industrial; public service; residential; recreational; ecological; mine; mining; wetlands |
| Koppers Coke (pdf) (710 KB) | MN | 5 | 2012 | commercial; industrial; public service |
| Lexington County Landfill Area (pdf) (1.15 MB) | SC | 4 | 2014 | recreational; commercial; public service; landfill |
| Liberty Industrial Finishing (pdf) (1.23 MB) | NY | 2 | 2014 | recreational; commercial; ecological |
| Lindsay Manufacturing Co. (pdf) (860 KB) | NE | 7 | 2017 | industrial; agricultural; groundwater |
| Lipari Landfill (pdf) (5.29 MB) | NJ | 2 | 2020 | recreational; ecological; landfill |
| Loring Air Force Base (pdf) (5.71 MB) | ME | 1 | 2018 | recreational; ecological; commercial; industrial; public service; residential; federal; military; energy; solar |
| Macalloy Corporation (pdf) (467 KB) | SC | 4 | 2012 | industrial |
| Martin-Marietta, Sodyeco, Inc. (pdf) (1.5 MB) | NC | 4 | 2018 | recreational; ecological; industrial; commercial; agricultural; energy; biomass |
| Materials Technology Laboratory (USARMY) (pdf) (1.82 MB) | MA | 1 | 2018 | recreational; ecological; commercial; public service; military; federal; residential |
| Midvale Slag (pdf) (3.13 MB) | UT | 8 | 2015 | commercial; residential; recreational; public service; ecological |
| Murray Smelter (pdf) (3.13 MB) | UT | 8 | 2012 | public service; commercial; industrial; recreational; ecological; residential |
| Naval Industrial Reserve Ordnance Plant (pdf) (2.44 MB) | MN | 5 | 2020 | commercial; industrial; military |
| North Penn - Area 12 (pdf) (546 KB) | PA | 3 | 2014 | recreational; industrial |
| North Ridge Estates (pdf) (2.18 MB) | OR | 10 | 2018 | residential; recreational; ecological; military |
| Northwest Pipe & Casing/Hall Process Company (pdf) (1.12 MB) | OR | 10 | 2015 | industrial; commercial; public service; energy; solar; wetlands |
| Onondaga Lake (pdf) (1.98 MB) | NY | 2 | 2018 | recreational; ecological; commercial; industrial; public service; sediment; wetlands |
| Operating Industries, Inc., Landfill (pdf) (1.93 MB) | CA | 9 | 2020 | commercial; landfill; landfill gas; solar; energy |
| Pacific Sound Resources (pdf) (1.66 MB) | WA | 10 | 2013 | commercial; industrial; recreational; ecological; wood-treating; sediment |
| Pease Air Force Base (pdf) (2.26 MB) | NH | 1 | 2018 | recreational; ecological; commercial; industrial; public service; military; federal |
| Peterson/Puritan, Inc. (pdf) (2.21 MB) | RI | 1 | 2014 | recreational; commercial; industrial; public service; residential; ecological; federal; energy; solar; landfill |
| Phoenix-Goodyear Airport Area (pdf) (821 KB) | AZ | 9 | 2015 | industrial; commercial; recreational; public service; agricultural; groundwater; military; residential |
| PJP Landfill (pdf) (2.19 MB) | NJ | 2 | 2016 | recreational; ecological; commercial; industrial; landfill; wetlands; public service |
| PMC Groundwater (pdf) (1.35 MB) | MI | 5 | 2014 | recreational; commercial; public service; residential; federal; groundwater |
| Portland Cement (Kiln Dust 2 & 3) (pdf) (1.61 MB) | UT | 8 | 2019 | commercial; industrial; public service; recreational |
| Raymark Industries, Inc. (pdf) (1.25 MB) | CT | 1 | 2016 | commercial |
| Reilly Tar & Chemical Corp. (Indianapolis Plant) (pdf) (4.52 MB) | IN | 5 | 2023 | residential; industrial; commercial; energy; solar; landfill; capped |
| Reynolds Metals Company (pdf) (1.88 MB) | OR | 10 | 2019 | commercial; industrial; recreational; ecological |
| Roebling Steel Co. (pdf) (1.34 MB) | NJ | 2 | 2016 | recreational; public service; capped; wetlands; sediment; commercial; industrial |
| RSR Corporation (pdf) (8.85 MB) | TX | 6 | 2023 | residential; commercial; public service; recreational; industrial |
| San Fernando Valley (Area 1) (pdf) (5.76 MB) | CA | 9 | 2018 | commercial; industrial; public service; groundwater |
| Sherwood Medical Co. (pdf) (1.02 MB) | NE | 7 | 2015 | industrial; residential; groundwater |
| SMS Instruments, Inc. (pdf) (1.16 MB) | NY | 2 | 2014 | commercial; industrial |
| Sola Optical USA, Inc. (pdf) (727 KB) | CA | 9 | 2016 | industrial; agricultural; commercial |
| Solitron Microwave (pdf) (3.06 MB) | FL | 4 | 2022 | ecological; commercial; industrial; wetlands |
| South Andover Site (pdf) (553 KB) | MN | 5 | 2011 | recreational; commercial |
| South Bay Asbestos Area (pdf) (2.9 MB) | CA | 9 | 2021 | ecological; residential; commercial; industrial; federal; landfill |
| South Point Plant (pdf) (4.21 MB) | OH | 5 | 2020 | recreational; commercial; industrial; public service; capped |
| Southside Sanitary Landfill (pdf) (394 KB) | IN | 5 | 2011 | recreational; industrial; public service; energy; landfill gas; landfill |
| State Marine of Port Arthur and Palmer Barge Line (pdf) (807 KB) | TX | 7 | 2017 | industrial; landfill; capped |
| Strother Field Industrial Park (pdf) (1.42 MB) | KS | 7 | 2015 | commercial; industrial; public service; solar; landfill; energy; capped |
| Tucson International Airport Area (pdf) (1.63 MB) | AZ | 9 | 2016 | industrial; commercial; federal; military; public service; energy; solar; groundwater; landfill |
| Universal Oil Products (Chemical Division) (pdf) (3.89 MB) | NJ | 2 | 2020 | ecological; commercial; public service; vapor intrusion; wetlands; capped |
| Vasquez Boulevard and I-70 (pdf) (4.3 MB) | CO | 8 | 2017 | commercial; industrial; residential; public service; recreational |
| Ventron/Velsicol (pdf) (3.28 MB) | NJ | 2 | 2021 | recreational; ecological; commercial; industrial; energy; solar; vapor intrusion; capped |
| Vertac, Inc. (pdf) (662 KB) | AR | 6 | 2012 | public service; recreational; landfill |
| Waite Park Wells (pdf) (2.02 MB) | MN | 5 | 2018 | recreational; commercial; industrial; public service |
| Waste Disposal, Inc. (pdf) (1.04 MB) | CA | 9 | 2014 | commercial; industrial; vapor intrusion; capped |
| Wells G&H (pdf) (2.38 MB) | MA | 1 | 2018 | recreational; ecological; commercial; industrial; public service; capped; wetlands |
| Welsbach & General Gas Mantle (Camden Radiation) (pdf) (4.34 MB) | NJ | 2 | 2020 | recreational; commercial; industrial; public service; energy; solar |
| Whitmoyer Laboratories (pdf) (5.79 MB) | PA | 3 | 2020 | recreational; ecological; capped |
Information about Site-Specific Economic Highlights
The reuse of Superfund sites provides a wide range of benefits to communities across the country. Some of these benefits are easy to quantify; others are not. For example, commercial or industrial reuse of a site can bolster local economies by supporting jobs and generating sales revenues. However, not all sites in reuse involve an on-site business or other land use that employs people. Therefore, economic information is not available for all sites in reuse. This could be attributed to several factors, including:
- There may be no revenue-generating businesses on-site.
- There may be a business or businesses on-site for which economic information is not available.
- In some cases, due to the large footprint of a site, it may not be feasible to collect economic information for such a large area (i.e., an entire town). In these cases, a site reuse snapshot may discuss widespread site reuse, but economic information may not be available for the site.
- Due to a time lag between when site reuse snapshots are updated and when economic information is updated annually, it is possible that economic research may not be performed to capture new reuse mentioned in a snapshot until after the update of the snapshot.
Many sites without businesses have beneficial effects that are not easily quantified, such as areas providing ecological and recreational benefits, such as parks, wetlands, ecological habitat and open space. Also, not all sites in reuse are well-suited for revenue-generating reuse. If a site is not located in an area suited for commercial or industrial reuse, a redevelopment project that supports jobs may not be a realistic option. SRP quantifies many types of beneficial effects of reuse at Superfund sites, including the number of on-site jobs, estimated annual employment income and sales revenue generated by on-site businesses.
EPA obtains economic data for sites in reuse from reputable sources. Information on the number of employees and sales volume for on-site businesses typically comes from the Hoovers/Dun & Bradstreet database. When Hoovers/D&B database research is not able to identify employment and sales information for on-site businesses, EPA uses the Manta and Reference Solutions databases. These databases include data reported by businesses. Accordingly, some reported values might be underestimates or overestimates. In some instances, business and employment information comes from local newspaper stories/articles and discussions with local officials and business representatives. In general, economic information gathered for sites in reuse is conservative, based on available resources. In some cases, especially for exceptionally large sites, the economic information presented may not be comprehensive for an entire site, presenting a conservative estimate of the economic benefits of reuse at the site.