
EPA Research Improves Air Quality Information for the Public on the AirNow Fire and Smoke Map
Published July 5, 2022
Air sensors, more portable and easier to use than conventional regulatory air monitors, have become increasingly popular for measuring air pollution across the United States, particularly during wildfires. Researchers and communities have used air sensors to fill gaps in understanding local air quality. However, these sensors can often incorrectly estimate pollutant levels compared to regulatory-grade monitors. EPA researchers want to make it easier to compare the data from air sensors with data from highly accurate monitors. To do this, they have collocated, or placed sensors side-by-side with accurate regulatory monitors, in several locations throughout the country.
One widely used sensor type, the PurpleAir, was tested at more than 70 locations throughout the United States by EPA researchers and more than 30 state, local, and tribal air agency partners. While there are several options for air sensors on the market, the popularity of PurpleAir sensors meant the researchers could tap into a widespread sensor network spanning the country. Using this data, EPA researchers developed a mathematical equation, called a “correction equation,” to adjust the air sensor data, making the making the data more accurate and comparable to the regulatory network.
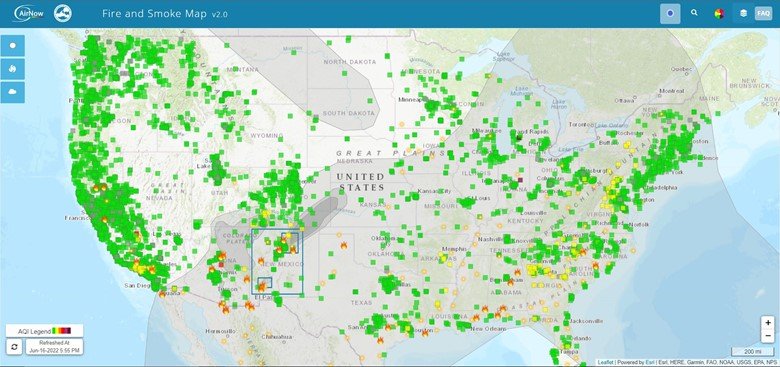
The publicly available, crowdsourced PurpleAir data provides supplemental air quality information in areas between regulatory monitors. EPA and the U.S. Forest Service apply the correction equation to the sensor data and displays them alongside regulatory monitoring data on the AirNow Fire and Smoke Map, an online platform that shows fine particle pollution data and real-time information on fires and smoke. People have visited the AirNow Fire and Smoke Map more than 24 million times since it was launched in the summer of 2020. This resource has enhanced information to help communities better understand their air quality near fires.
Chet Wayland, Director of EPA’s air quality monitoring programs, says “Air sensors can be useful for providing supplemental air quality information in areas between regulatory monitors.” The AirNow Fire and Smoke Map is a great example, he says, where crowdsourced data from nearly 13,000 air sensors brings additional information to people living in areas affected by wildfire smoke. “The correction equation developed by EPA scientists allows us to show the sensor data on the map, in a format that you can compare to information from regulatory monitors operated by experts,” he says.
EPA scientist Karoline Barkjohn led the development of the correction equation. “I think the public wants to see all the air quality information available in one place, instead of going to different sources to understand the story,” she says. “We thought it was important to correct the air sensor data so communities can get an apples-to-apples comparison without having to interpret data themselves.”
Today, the map combines the corrected data from air sensors with measurements from regulatory-grade air monitors, and temporary smoke monitors, allowing users to compare the three data sources and providing the most comprehensive source for information on air quality during fires.
The correction equation continues to have real-world impacts for those who need accurate and timely air quality information. Starting this month, Google has begun leveraging EPA’s sensor correction equation to provide air quality information for Google Maps users. In addition to displaying the Air Quality Index from government monitoring stations, the Google Maps app for Android and iOS now shows data from the nationwide network of PurpleAir sensors, using EPA’s correction equation to increase the accuracy of sensor measurements.
As the field of air sensors grows, EPA researchers continue to test a variety of air sensor technologies for accuracy and reliability. EPA’s Andrea Clements, who conducts air sensor research, says she is hopeful that the development of the correction equation motivates sensor manufacturers to “better understand and improve their data so that, together, we can provide a more consistent picture of air quality across the U.S.”
Why should I use the Fire and Smoke Map?
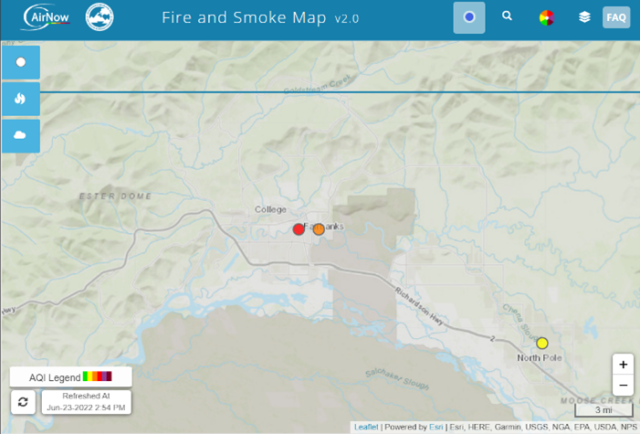
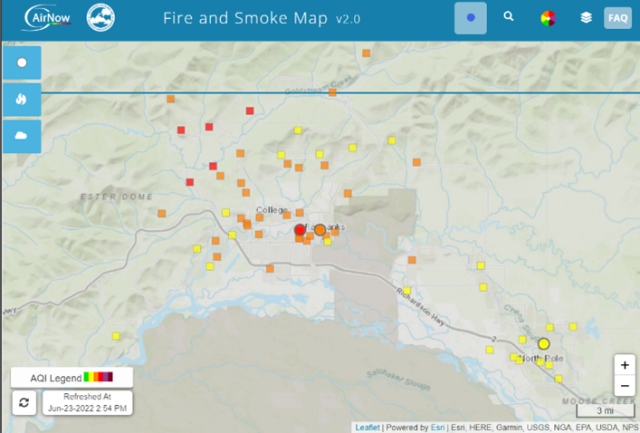
- The AirNow Fire and Smoke Map offers a host of fire and health-related information all in one place, based on your location. Visit the map to see information on:
- The current particle pollution Air Quality Index.
- Fire and smoke plume locations.
- Smoke forecast outlooks.
- Actions to take to protect yourself based on current air quality at your location.
Related Resources
Study Explores Ways to Improve Accuracy of Air Sensors
Technical Approaches for the Sensor Data on the AirNow Fire and Smoke Map