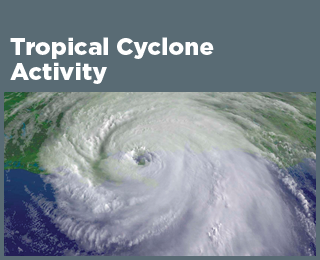
Climate Change Indicators: Tropical Cyclone Activity
This indicator examines the frequency, intensity, and duration of hurricanes and other tropical storms in the Atlantic Ocean, Caribbean, and Gulf of America.
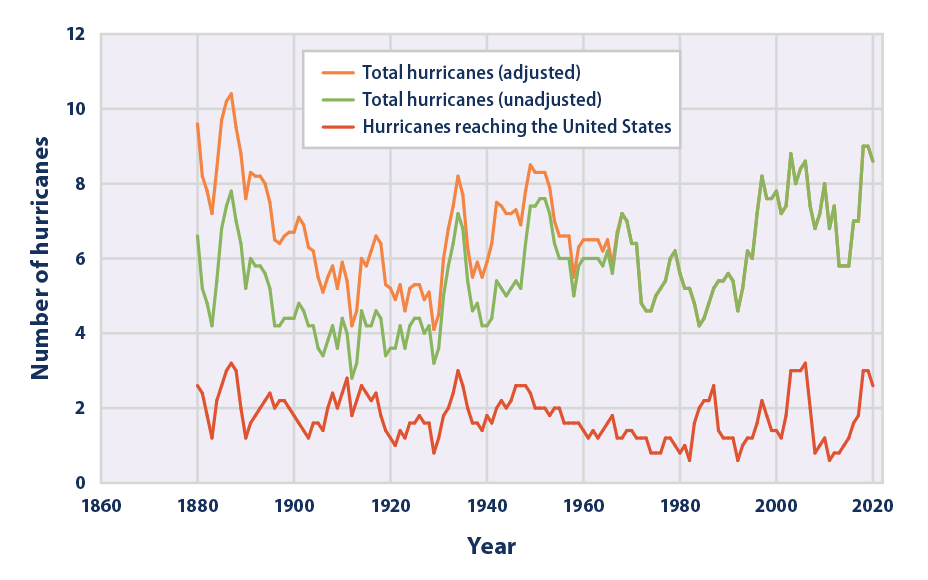
This graph shows the number of hurricanes that formed in the North Atlantic Ocean each year from 1878 to 2022, along with the number that made landfall in the United States. The orange curve shows how the total count in the green curve can be adjusted to attempt to account for the lack of aircraft and satellite observations in early years. All three curves have been smoothed using a five-year average, plotted at the middle year. The most recent average (2018–2022) is plotted at 2020.
Data source: NOAA, 2023;3 Vecchi and Knutson, 20114
Web update: June 2024
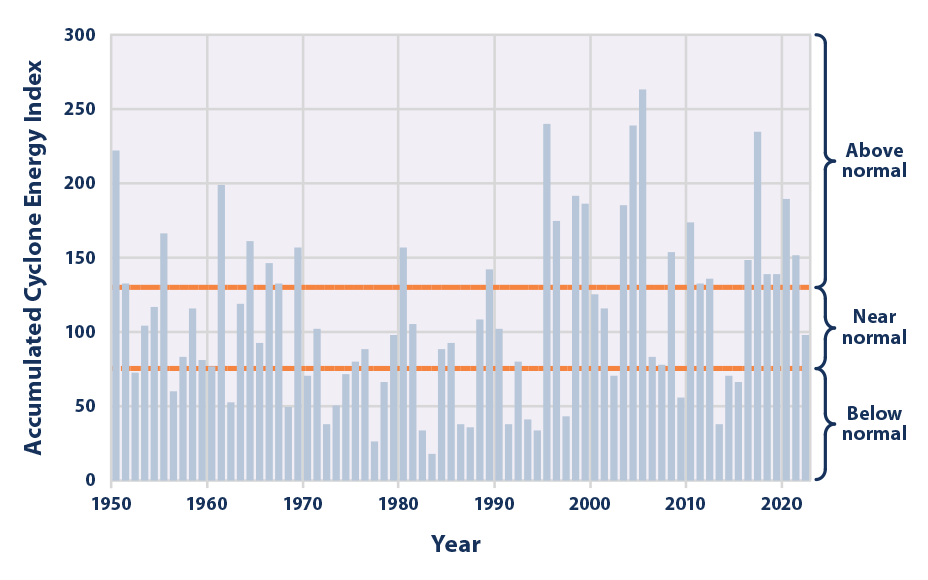
This figure shows total annual Accumulated Cyclone Energy (ACE) Index values, which account for cyclone strength, duration, and frequency, from 1950 through 2022. The National Oceanic and Atmospheric Administration has defined “near normal,” “above normal,” and “below normal” ranges based on the distribution of ACE Index values over the 70 years from 1951 to 2020.
Data source: NOAA, 20233
Web update: June 2024
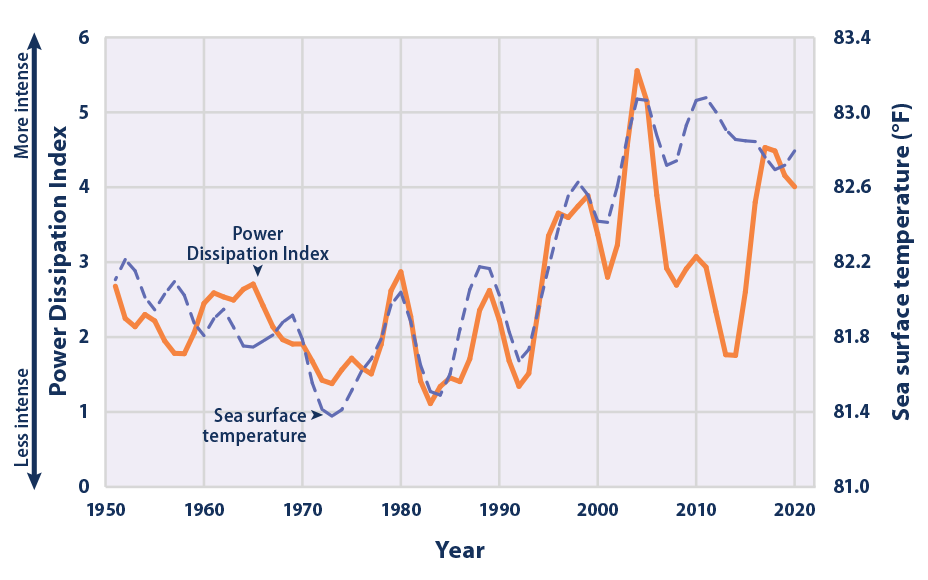
This figure presents annual values of the Power Dissipation Index (PDI), which accounts for cyclone strength, duration, and frequency. Tropical North Atlantic sea surface temperature trends are provided for reference. Note that sea surface temperature is measured in different units, but the values have been plotted alongside the PDI to show how they compare. The lines have been smoothed using a five-year weighted average, plotted at the middle year. The most recent average (2018–2022) is plotted at 2020.
Data source: Emanuel, 20235
Web update: June 2024
Key Points
- Since 1878, about six to seven hurricanes have formed in the North Atlantic every year. Roughly two per year make landfall in the United States. The total number of hurricanes (particularly after being adjusted for improvements in observation methods) and the number reaching the United States do not indicate a clear overall trend since 1878 (see Figure 1).
- According to the total annual ACE Index, cyclone intensity has risen noticeably over the past 30 years, and eight of the 10 most active years since 1950 have occurred since the mid-1990s (see Figure 2). Relatively high levels of cyclone activity were also seen during the 1950s and 1960s.
- The PDI (see Figure 3) shows fluctuating cyclone intensity for most of the mid- to late 20th century, followed by a noticeable increase since 1995 (similar to the ACE Index). These trends are shown with associated variations in sea surface temperature in the tropical North Atlantic for comparison (see Figure 3).
- The results described above generally align with global trends reported in the most recent assessment by the Intergovernmental Panel on Climate Change. Studies generally agree that tropical cyclone intensity has increased around the world over approximately the past 40 years, but changes in observation methods over time make it difficult to know whether intensity or frequency have increased over the full period with available data.1
Background
Hurricanes, tropical storms, and other intense rotating storms fall into a general category called cyclones. There are two main types of cyclones: tropical and extratropical (those that form outside the tropics). Tropical cyclones get their energy from warm tropical oceans. Extratropical cyclones get their energy from the jet stream and from temperature differences between cold, dry air masses from higher latitudes and warm, moist air masses from lower latitudes.
This indicator focuses on tropical cyclones in the Atlantic Ocean, Caribbean, and Gulf of America. Tropical cyclones are most common during the “hurricane season,” which runs from June through November. The effects of tropical cyclones are numerous and well known. At sea, storms disrupt and endanger shipping traffic. When cyclones encounter land, their intense rains and high winds can cause severe property and infrastructure damage, loss of life, soil erosion, and flooding. The associated storm surge—the large volume of ocean water pushed toward shore by the cyclone’s strong winds—can cause severe flooding, erosion, and destruction.
Climate change is expected to affect tropical cyclones by increasing sea surface temperatures, a key factor that influences cyclone formation and behavior. The U.S. Global Change Research Program and the Intergovernmental Panel on Climate Change project that tropical cyclones will become more intense over the 21st century, with higher wind speeds and heavier rains.1,2
About the Indicator
Records of tropical cyclones in the Atlantic Ocean have been collected since the 1800s. The most reliable long-term records focus on hurricanes, which are the strongest category of tropical cyclones in the Atlantic, with wind speeds of at least 74 miles per hour. This indicator uses historical data from the National Oceanic and Atmospheric Administration to track the number of hurricanes per year in the North Atlantic (north of the equator) and the number reaching the United States since 1878. Some hurricanes over the ocean might have been missed before the start of aircraft and satellite observation, so scientists have used other evidence, such as ship traffic records, to estimate the actual number of hurricanes that might have formed in earlier years.
This indicator also looks at the Accumulated Cyclone Energy (ACE) Index and the Power Dissipation Index (PDI), which are two ways of monitoring the frequency, strength, and duration of tropical cyclones based on wind speed measurements.
Every cyclone has an ACE Index value, which is a number based on the maximum wind speed measured at six-hour intervals over the entire time that the cyclone is classified as at least a tropical storm (wind speed of at least 39 miles per hour). Therefore, a storm’s ACE Index value accounts for both strength and duration. The National Oceanic and Atmospheric Administration calculates the total ACE Index value for an entire hurricane season by adding the values for all named storms, including subtropical storms, tropical storms, and hurricanes. The resulting annual total accounts for cyclone strength, duration, and frequency. For this indicator, the index has been converted to a scale where 100 equals the median value (the midpoint) over a base period from 1951 to 2020. The thresholds in Figure 2 define whether the ACE Index for a given year is close to normal, significantly above normal, or significantly below normal.
Like the ACE Index, the PDI is based on measurements of wind speed, but it uses a different calculation method that places more emphasis on storm intensity. This indicator shows the annual PDI value, which represents the sum of PDI values for all named storms during the year.
About the Data
Indicator Notes
Over time, data collection methods have changed as technology has improved. For example, wind speed collection methods have evolved substantially over the past 60 years, while aircraft reconnaissance began in 1944 and satellite tracking around 1966. Figure 1 shows how older hurricane counts have been adjusted to attempt to account for the lack of aircraft and satellite observations. Changes in data gathering technologies could substantially influence the overall patterns in Figures 2 and 3. The effects of these changes on data consistency over the life of the indicator would benefit from additional research.
While Figures 2 and 3 cover several different aspects of tropical cyclones, there are other important factors not covered here, including the size of each storm, the amount of rain, and the height of the storm surge. The reason for the recent divergence between cyclone activity and sea surface temperature in Figure 3 has not been identified conclusively, but it may relate to other factors that influence the formation of storms, such as the difference in wind speeds at different levels in the atmosphere (called vertical wind shear) and the concentration of particles called aerosols in the atmosphere.1,6
Data Sources
Hurricane counts were compiled using methods described in Knutson et al. (2010).7 Data for Figures 1 and 2 came from the National Oceanic and Atmospheric Administration’s Hurricane Research Division, and are available online at: www.aoml.noaa.gov/hrd/hurdat/comparison_table.html. Values for Figure 3 have been calculated by Kerry Emanuel at the Massachusetts Institute of Technology. Both the ACE Index and the PDI are based on wind speed measurements compiled by the National Oceanic and Atmospheric Administration.
Technical Documentation
References
1 IPCC (Intergovernmental Panel on Climate Change). (2021). Climate change 2021—The physical science basis: Working Group I contribution to the Sixth Assessment Report of the Intergovernmental Panel on Climate Change (V. Masson-Delmotte, P. Zhai, A. Pirani, S. L. Connors, C. Péan, S. Berger, N. Caud, Y. Chen, L. Goldfarb, M. I. Gomis, M. Huang, K. Leitzell, E. Lonnoy, J. B. R. Matthews, T. K. Maycock, T. Waterfield, O. Yelekçi, R. Yu, & B. Zhou, Eds.). Cambridge University Press. https://doi.org/10.1017/9781009157896
2 USGCRP (U.S. Global Change Research Program). (2023). Fifth National Climate Assessment (A. R. Crimmins, C. W. Avery, D. R. Easterling, K. E. Kunkel, B. C. Stewart, & T. K. Maycock, Eds.). https://doi.org/10.7930/NCA5.2023
3 NOAA (National Oceanic and Atmospheric Administration). (2023). North Atlantic hurricane basin (1851–2022): Comparison of original and revised HURDAT. www.aoml.noaa.gov/hrd/hurdat/comparison_table.html
4 Vecchi, G. A., & Knutson, T. R. (2011). Estimating annual numbers of Atlantic hurricanes missing from the HURDAT database (1878–1965) using ship track density. Journal of Climate, 24(6), 1736–1746. https://doi.org/10.1175/2010JCLI3810.1
5 Emanuel, K. A. (2023). Update to data originally published in Emanuel, K. (2007). Environmental factors affecting tropical cyclone power dissipation. Journal of Climate, 20(22), 5497–5509. https://doi.org/10.1175/2007JCLI1571.1
6 Intergovernmental Panel on Climate Change. (2012). Managing the risks of extreme events and disasters to advance climate change adaptation: Special report of the Intergovernmental Panel on Climate Change. Cambridge University Press. www.ipcc.ch/pdf/special-reports/srex/SREX_Full_Report.pdf
7 Knutson, T. R., McBride, J. L., Chan, J., Emanuel, K., Holland, G., Landsea, C., Held, I., Kossin, J. P., Srivastava, A. K., & Sugi, M. (2010). Tropical cyclones and climate change. Nature Geoscience, 3(3), 157–163. https://doi.org/10.1038/ngeo779
Learn about other indicators in this section