U.S. flag

An official website of the United States government

Here’s how you know

Dot gov

Official websites use .gov
A .gov website belongs to an official government organization in the United States.

HTTPS

Secure .gov websites use HTTPS
A lock (LockA locked padlock) or https:// means you’ve safely connected to the .gov website. Share sensitive information only on official, secure websites.

    • Environmental Topics
    • Air
    • Bed Bugs
    • Cancer
    • Chemicals, Toxics, and Pesticide
    • Emergency Response
    • Environmental Information by Location
    • Health
    • Land, Waste, and Cleanup
    • Lead
    • Mold
    • Radon
    • Research
    • Science Topics
    • Water Topics
    • A-Z Topic Index
    • Laws & Regulations
    • By Business Sector
    • By Topic
    • Compliance
    • Enforcement
    • Laws and Executive Orders
    • Regulations
    • Report a Violation
    • Environmental Violations
    • Fraud, Waste or Abuse
    • About EPA
    • Our Mission and What We Do
    • Headquarters Offices
    • Regional Offices
    • Labs and Research Centers
    • Planning, Budget, and Results
    • Organization Chart
    • EPA History

Breadcrumb

  1. Home
  2. Climate Change Indicators
  3. View the Indicators
  4. Weather and Climate

Climate Change Indicators: U.S. and Global Precipitation

This indicator describes trends in average precipitation for the United States and the world.


This figure shows how the total annual amount of precipitation in the contiguous 48 states has changed since 1901. This graph uses the 1901–2000 average as a baseline for depicting change. Choosing a different baseline period would not change the shape of the data over time. 


This figure shows how the total annual amount of precipitation over land worldwide has changed since 1901. This graph uses the 1901–2000 average as a baseline for depicting change. Choosing a different baseline period would not change the shape of the data over time.

Figure 3. Change in Precipitation in the United States, 1901–2023 
Color-coded map showing the percent change in precipitation across the United States from 1901 to 2023.
Download Data  Download Image   View Interactive Map

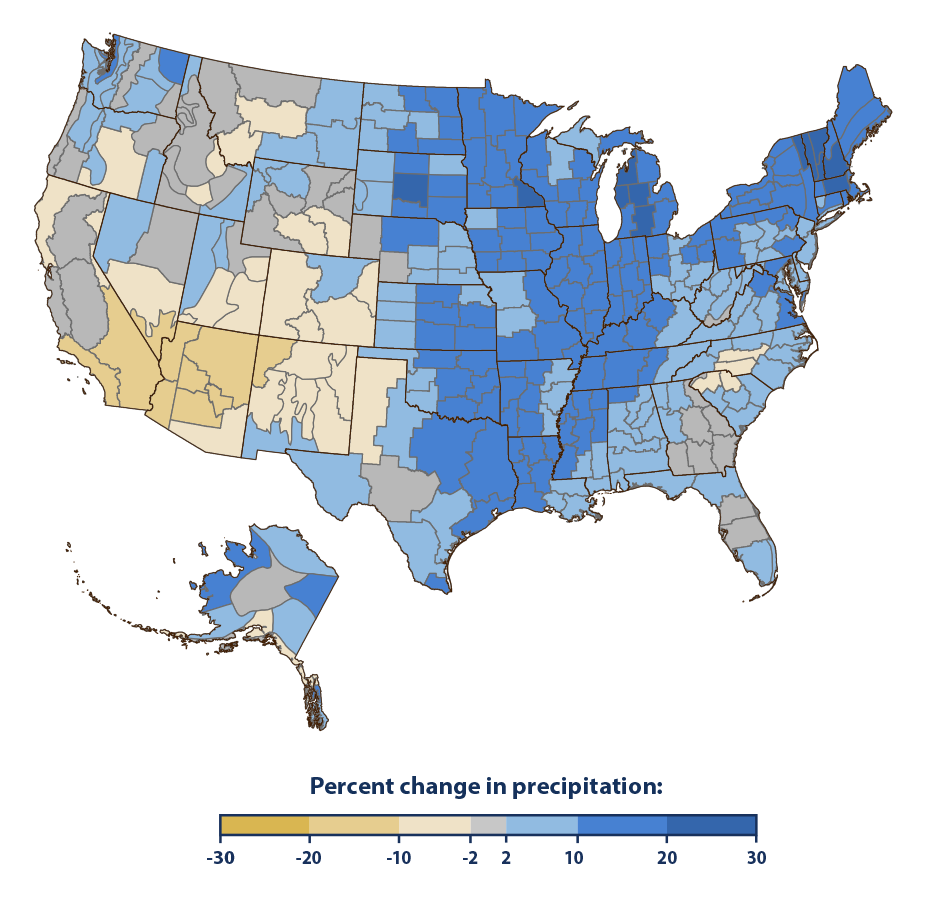
This figure shows the percent change in total annual precipitation in different parts of the United States since the early 20th century (since 1901 for the contiguous 48 states and 1925 for Alaska). The data are shown for climate divisions, as defined by the National Oceanic and Atmospheric Administration.

Data source: NOAA, 20241
Web update: June 2024

Key Points | Background | About the Indicator | About the Data | Technical Documentation

Key Points

  • On average, total annual precipitation has increased over land areas in the United States and worldwide (see Figures 1 and 2). Since 1901, global precipitation has increased at an average rate of 0.03 inches per decade, while precipitation in the contiguous 48 states has increased at a rate of 0.18 inches per decade.
  • Some parts of the United States have experienced greater increases in precipitation than others. A few areas, such as the Southwest, have seen a decrease in precipitation (see Figure 3). Not all of these regional trends are statistically significant, however.

Background

Precipitation can have wide-ranging effects on human well-being and ecosystems. Rainfall, snowfall, and the timing of snowmelt can all affect the amount of surface water and groundwater available for drinking, irrigation, and industry. They also influence river flooding and can determine what types of animals and plants (including crops) can survive in a particular place. Changes in precipitation can disrupt a wide range of natural processes, particularly if these changes occur more quickly than plant and animal species can adapt.

As average temperatures at the Earth’s surface rise (see the U.S. and Global Temperature indicator), more evaporation and transpiration occur, adding more moisture to the air, which in turn increases overall precipitation. Therefore, a warming climate is expected to increase precipitation in many areas. Just as precipitation patterns vary across the world, however, so do the effects of climate change on precipitation. By shifting the wind patterns and ocean currents that drive the world’s climate system, climate change will also cause some areas to experience decreased precipitation. In addition, areas with increased precipitation will not necessarily have more water available for people and ecosystems because higher temperatures also lead to more evaporation (see the Drought indicator).

About the Indicator

This indicator examines U.S. and global precipitation patterns, based on rainfall and snowfall measurements from land-based weather stations worldwide. This indicator starts at 1901 except for the detailed map of Alaska, where reliable statewide records are available back to 1925. The indicator extends through 2023.

This indicator shows annual anomalies, or differences, compared with the average precipitation from 1901 to 2000. At each weather station, annual precipitation anomalies were calculated from total annual precipitation in inches. Anomalies for the contiguous 48 states and Alaska have been determined by calculating average precipitation anomalies for areas within each state based on station density and topography. These regional anomalies are then averaged together in proportion to their area to develop national results. Similarly, global anomalies have been determined by dividing the world into a grid, averaging the data for each cell of the grid, and then averaging the grid cells together.

About the Data

Indicator Notes

Data from the early 20th century are somewhat less precise because there were fewer stations collecting measurements at the time. To ensure that overall trends are reliable, the data have been adjusted where possible to account for any biases that might be introduced by factors such as station relocation or changes in measurement instruments.

Hawai'i and U.S. territories are not included, due to limitations in available data.

Data Sources

The data for this indicator were provided by the National Oceanic and Atmospheric Administration’s National Centers for Environmental Information, which maintains a large collection of climate data online at: www.ncei.noaa.gov. The precipitation anomalies shown here were calculated based on monthly values from a network of long-term monitoring stations.

Technical Documentation

  • Download related technical information (pdf)

References

1 NOAA (National Oceanic and Atmospheric Administration). (2024). Climate at a glance. Retrieved March 25, 2024, from www.ncei.noaa.gov/access/monitoring/climate-at-a-glance

2 NOAA (National Oceanic and Atmospheric Administration). (2024). Extended version of GPCC dataset originally published in Blunden, J., Boyer, T., & Bartow-Gillies, E. (2023). State of the climate in 2022. Bulletin of the American Meteorological Society, 104(9), S1–S516. https://doi.org/10.1175/2023BAMSStateoftheClimate.1


Learn about other indicators in this section

U.S. and Global Temperature
Seasonal Temperature
High and Low Temperatures
Heat Waves
U.S. and Global Precipitation
Heavy Precipitation
Tropical Cyclone Activity
River Flooding
Drought
Temperature and Drought in the Southwest

Climate Change Indicators

  • View the Indicators
    • Greenhouse Gases
      • U.S. Greenhouse Gas Emissions
      • Global Greenhouse Gas Emissions
      • Atmospheric Concentrations of Greenhouse Gases
      • Climate Forcing
    • Weather and Climate
      • U.S. and Global Temperature
      • Seasonal Temperature
      • High and Low Temperatures
      • Heat Waves
      • U.S. and Global Precipitation
      • Heavy Precipitation
      • Tropical Cyclone Activity
      • River Flooding
      • Drought
      • A Closer Look: Temperature and Drought in the Southwest
    • Oceans
      • Ocean Heat
      • Sea Surface Temperature
      • Marine Heat Waves
      • Sea Level
      • A Closer Look: Land Loss Along the Atlantic Coast
      • Coastal Flooding
      • Ocean Acidity
    • Snow and Ice
      • Arctic Sea Ice
      • Antarctic Sea Ice
      • Ice Sheets
      • Glaciers
      • Arctic Glaciers
      • A Closer Look: Glaciers in Glacier National Park
      • Lake Ice
      • Great Lakes Ice Cover
      • Community Connection: Ice Breakup in Three Alaskan Rivers
      • Snowfall
      • Snow Cover
      • Snowpack
      • Permafrost
      • Freeze-Thaw Conditions
    • Health and Society
      • Heat-Related Deaths
      • A Closer Look: Heat-Related Workplace Deaths
      • Heat-Related Illnesses
      • Cold-Related Deaths
      • Heating and Cooling Degree Days
      • Residential Energy Use
      • Lyme Disease
      • West Nile Virus
      • Length of Growing Season
      • Growing Degree Days
      • Ragweed Pollen Season
    • Ecosystems
      • Wildfires
      • Streamflow
      • Stream Temperature
      • Tribal Connection: Trends in Stream Temperature in the Snake River
      • Lake Temperature
      • Great Lakes Water Levels and Temperatures
      • Bird Wintering Ranges
      • A Closer Look: The Black Guillemots of Cooper Island
      • Marine Species Distribution
      • Leaf and Bloom Dates
      • Community Connection: Cherry Blossom Bloom Dates in Washington, D.C.
  • Dig into the Data
    • Map Explorer Basics
    • Southwest Case Study
  • Indicator Stories
    • Indicator Infographics
    • Community Connections
    • Indicators Overview StoryMap
    • Seasonality and Climate Change
  • About the Indicators
    • Data Sources and Methods
    • Frequent Questions about the Indicators
    • Publications
Contact Us About Climate Indicators
Contact Us to ask a question, provide feedback, or report a problem.
Last updated on May 9, 2025
  • Assistance
  • Spanish
  • Arabic
  • Chinese (simplified)
  • Chinese (traditional)
  • French
  • Haitian Creole
  • Korean
  • Portuguese
  • Russian
  • Tagalog
  • Vietnamese
United States Environmental Protection Agency

Discover.

  • Accessibility Statement
  • Budget & Performance
  • Contracting
  • EPA www Web Snapshot
  • Grants
  • No FEAR Act Data
  • Plain Writing
  • Privacy
  • Privacy and Security Notice

Connect.

  • Data
  • Inspector General
  • Jobs
  • Newsroom
  • Regulations.gov
  • Subscribe
  • USA.gov
  • White House

Ask.

  • Contact EPA
  • EPA Disclaimers
  • Hotlines
  • FOIA Requests
  • Frequent Questions
  • Site Feedback

Follow.