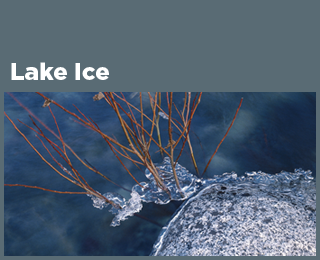
Climate Change Indicators: Lake Ice
This indicator measures the amount of time that ice is present on lakes in the United States.
Figure 1. Date of First Freeze for Selected U.S. Lakes, 1850–2019 
This figure shows the “ice-on” date, or date of first freeze, for nine U.S. lakes. The data are available from as early as 1850 to 2019, depending on the lake, and have been smoothed using a nine-year moving average.
Data source: Various organizations2
Web update: April 2021
Figure 2. Date of Ice Thaw for Selected U.S. Lakes, 1840–2019 
This figure shows the “ice-off” date, or date of ice thawing and breakup, for 14 U.S. lakes. The data are available from as early as 1840 to 2019, depending on the lake, and have been smoothed using a nine-year moving average.
Data source: Various organizations2
Web update: April 2021
Figure 3. Change in Ice Thaw Dates for Selected U.S. Lakes, 1905–2019 
This figure shows the change in the “ice-off” date, or date of ice thawing and breakup, for 14 U.S. lakes during the period from 1905 to 2019. Twelve of the lakes have red circles with negative numbers, which represent earlier thaw dates. Larger circles indicate larger changes. Two of the lakes had no change in thaw dates.
Data source: Various organizations2
Web update: April 2021
Key Points
- The lakes covered by this indicator are generally freezing later than they did in the past. Freeze dates have shifted later at a rate of roughly half a day to one-and-a-half days per decade (see Figure 1).
- Thaw dates for most of these lakes show a trend toward earlier ice breakup in the spring (see Figure 2). Spring thaw dates have grown earlier by up to 24 days since 1905 (see Figure 3). Nearly all of these lakes were found to be thawing earlier in the year.
- The changes in lake freeze and thaw dates shown here are consistent with other studies. For example, long-term ice data from lakes and rivers throughout the Northern Hemisphere reveal that since the mid-1800s, freeze dates have occurred later and thaw dates have occurred earlier, both shifting at an average rate of 0.8 days to one day per decade.1
Background
The formation of ice cover on lakes in the winter and its disappearance the following spring depends on climate factors such as air temperature, cloud cover, and wind. Conditions such as heavy rains or snowmelt in locations upstream or elsewhere in the watershed also affect the length of time a lake is frozen. Thus, ice formation and breakup dates are key indicators of climate change. If lakes remain frozen for longer periods, it can signify that the climate is cooling. Conversely, shorter periods of ice cover suggest a warming climate.
Changes in ice cover can affect the physical, chemical, and biological characteristics of a body of water. For example, ice influences heat and moisture transfers between a lake and the atmosphere. Reduced lake ice cover leads to increased evaporation and lower water levels, as well as an increase in water temperature and sunlight penetration. These changes, in turn, can affect plant and animal life cycles and the availability of suitable habitat. Additionally, ice cover affects the amount of heat that is reflected from the Earth’s surface. Exposed water will absorb and retain heat, making the Earth’s surface warmer, whereas an ice- and snow-covered lake will reflect more of the sun’s energy and absorb less. (For more information on ice and snow reflecting sunlight, see the Snow Cover indicator.)
The timing and duration of ice cover on lakes and other bodies of water can also affect society—particularly in relation to shipping and transportation, hydroelectric power generation, and fishing. The impacts can be positive or negative. For example, reduced ice cover on a large lake could extend the open-water shipping season but require vessels to reduce their cargo capacity, as increased evaporation leads to lower water levels.
About the Indicator
This indicator analyzes the dates at which lakes freeze and thaw. Freeze dates occur when a continuous and immobile ice cover forms over a body of water. Thaw dates occur when the ice cover breaks up and open water becomes extensive.
Freeze and thaw dates have been recorded through human visual observations for more than 150 years. The National Snow and Ice Data Center maintains a database with freeze and thaw observations from more than 850 lakes and rivers throughout the Northern Hemisphere. This indicator focuses on 14 lakes within the United States that have the longest and most complete historical records. The lakes of interest are located in Minnesota, Wisconsin, New York, and Maine.
About the Data
Indicator Notes
Although there is a lengthy historical record of freeze and thaw dates for a much larger set of lakes and rivers, some records are incomplete, with breaks ranging from brief lapses to large gaps in data. This indicator is limited to 14 lakes with sufficiently complete historical records. The four Maine lakes and Lake Osakis only have data for ice thaw, so they do not appear in Figure 1 (first freeze date).
Data used in this indicator are all based on visual observations. While the procedures for making observations of lake ice are consistent over time, visual observations by individuals are open to some interpretation and can differ from one individual to the next. In addition, historical observations for lakes have typically been made from a particular spot on the shore, which might not be representative of lakes as a whole or comparable to satellite-based observations. Considerations for defining the thaw date are specific to each lake.
Data Sources
Data through 2004 for most lakes were obtained from the Global Lake and River Ice Phenology Database, which is maintained by the National Snow and Ice Data Center. These data are available at: https://nsidc.org/data/lake_river_ice. More recent data were obtained from state, local, and other organizations that collected or compiled the observations.
Technical Documentation
References
1 Benson, B. J., Magnuson, J. J., Jensen, O. P., Card, V. M., Hodgkins, G., Korhonen, J., Livingstone, D. M., Stewart, K. M., Weyhenmeyer, G. A., & Granin, N. G. (2012). Extreme events, trends, and variability in Northern Hemisphere lake-ice phenology (1855–2005). Climatic Change, 112(2), 299–323. https://doi.org/10.1007/s10584-011-0212-8
2 [see full list provided below]
Lake Ice: Citations for Figures 1, 2, and 3
Figure 1
Detroit Lake, Minnesota, 2002–2018
Minnesota Department of Natural Resources. Retrieved October 2020 from www.dnr.state.mn.us/lakefind/ice.html?id=03038100
Geneva Lake, Wisconsin, 2005–2015
Geneva Lake Environmental Agency. Geneva Waters. Retrieved June 2016 from www.gleawi.org/geneva-waters-newsletter
Geneva Lake, Wisconsin, 2016
Lake Geneva Regional News. Retrieved August 2017 from https://lakegenevanews.net
Geneva Lake, Wisconsin, 2018
Geneva Lake Environmental Agency. (2019). Geneva Waters, 34(1). Retrieved October 2020 from https://1be5091b-f177-405b-8cd1-465d92736d06.filesusr.com/ugd/456c61_a175eeadb0eb41aa8d3682c2a8b99809.pdf
Lake George, New York, 2005–2018
Lake George Association. Retrieved October 2020 from https://lakegeorgeassociation.org
Lake Mendota and Lake Monona, Wisconsin, 2013–2019
Wisconsin State Climatology Office. Retrieved October 2020 from https://climatology.nelson.wisc.edu
Mirror Lake, New York, 2015–2019
Ausable River Association. Retrieved October 2020 from www.ausableriver.org/watershed/lakes/mirror-lake/mirror-lake-ice-record
Otsego Lake, New York, 2005–2018
State University of New York Oneonta Biological Field Station. Annual reports. Retrieved October 2020 from https://suny.oneonta.edu/biological-field-station/publications
Shell Lake, Wisconsin, 2005–2015
Washburn County Clerk. (2016). Personal communication.
All other data
Benson, B., Magnuson, J., & Sharma, S. (2020). Global Lake and River Ice Phenology Database (Version 1) [Data set]. National Snow and Ice Data Center. Retrieved March 1, 2021, from https://nsidc.org/data/g01377/versions/1
Figure 2
Cobbosseecontee Lake, Damariscotta Lake, Moosehead Lake, and Sebago Lake, Maine, 1800s–2008
Hodgkins, G. A. (2010). Historical ice-out dates for 29 Lakes in New England, 1807–2008 (Open-File Report 2010–1214). U.S. Geological Survey. https://pubs.usgs.gov/of/2010/1214
Cobbosseecontee Lake, Damariscotta Lake, Moosehead Lake, and Sebago Lake, Maine, 2009–2019
USGS (U.S. Geological Survey). (2021). Personal communication.
Detroit Lake, Minnesota, 2006–2019
Minnesota Department of Natural Resources. Retrieved October 2020 from www.dnr.state.mn.us/lakefind/ice.html?id=03038100
Lake Osakis, Minnesota, 2013–2019
Minnesota Department of Natural Resources. Retrieved October 2020 from www.dnr.state.mn.us/lakefind/ice.html?id=77021500
Geneva Lake, Wisconsin, 2005–2015
Geneva Lake Environmental Agency. Geneva Waters. Retrieved June 2016 from www.gleawi.org/geneva-waters-newsletter
Geneva Lake, Wisconsin, 2016
Lake Geneva Regional News. Retrieved August 2017 from https://lakegeorgeassociation.org
Lake George, New York, 2005–2018
Lake George Association. Retrieved October 2020 from https://lakegeorgeassociation.org
Lake Mendota and Lake Monona, Wisconsin, 2013–2019
Wisconsin State Climatology Office. Retrieved October 2020 from https://climatology.nelson.wisc.edu
Mirror Lake, New York, 2005–2019
Ausable River Association. Retrieved October 2020 from www.ausableriver.org/watershed/lakes/mirror-lake/mirror-lake-ice-record
Otsego Lake, New York, 2005–2018
State University of New York Oneonta Biological Field Station. Annual reports. Retrieved October 2020 from https://suny.oneonta.edu/biological-field-station/publications
Shell Lake, Wisconsin, 2005–2015
Washburn County Clerk. (2016). Personal communication.
All other data
Benson, B., Magnuson, J., & Sharma, S. (2020). Global Lake and River Ice Phenology Database (Version 1) [Data set]. National Snow and Ice Data Center. Retrieved March 1, 2021, from https://nsidc.org/data/g01377/versions/1
Figure 3
Cobbosseecontee Lake, Damariscotta Lake, Moosehead Lake, and Sebago Lake, Maine, 1905–2008
Hodgkins, G. A. (2010). Historical ice-out dates for 29 Lakes in New England, 1807–2008 (Open-File Report 2010–1214). U.S. Geological Survey. https://pubs.usgs.gov/of/2010/1214
Cobbosseecontee Lake, Damariscotta Lake, Moosehead Lake, and Sebago Lake, Maine, 2009–2019
USGS (U.S. Geological Survey). (2021). Personal communication.
Detroit Lake, Minnesota, 2006–2019
Minnesota Department of Natural Resources. Retrieved October 2020 from www.dnr.state.mn.us/lakefind/ice.html?id=03038100
Lake Osakis, Minnesota, 2013–2019
Minnesota Department of Natural Resources. Retrieved October 2020 from www.dnr.state.mn.us/lakefind/ice.html?id=77021500
Geneva Lake, Wisconsin, 2005–2015
Geneva Lake Environmental Agency. Geneva Waters. Retrieved June 2016 from www.gleawi.org/geneva-waters-newsletter
Geneva Lake, Wisconsin, 2016
Lake Geneva Regional News. Retrieved August 2017 from https://lakegeorgeassociation.org
Lake George, New York, 2005–2018
Lake George Association. Retrieved October 2020 from https://lakegeorgeassociation.org
Lake Mendota and Lake Monona, Wisconsin, 2013–2019
Wisconsin State Climatology Office. Retrieved October 2020 from https://climatology.nelson.wisc.edu
Mirror Lake, New York, 2005–2019
Ausable River Association. Retrieved October 2020 from www.ausableriver.org/watershed/lakes/mirror-lake/mirror-lake-ice-record
Otsego Lake, New York, 2005–2018
State University of New York Oneonta Biological Field Station. Annual reports. Retrieved October 2020 from https://suny.oneonta.edu/biological-field-station/publications
Shell Lake, Wisconsin, 2005–2015
Washburn County Clerk. (2016). Personal communication.
All other data
Benson, B., Magnuson, J., & Sharma, S. (2020). Global Lake and River Ice Phenology Database (Version 1) [Data set]. National Snow and Ice Data Center. Retrieved March 1, 2021, from https://nsidc.org/data/g01377/versions/1
Learn about other indicators in this section