Climate Change Indicators: Antarctic Sea Ice
This indicator tracks the extent of sea ice around Antarctica.
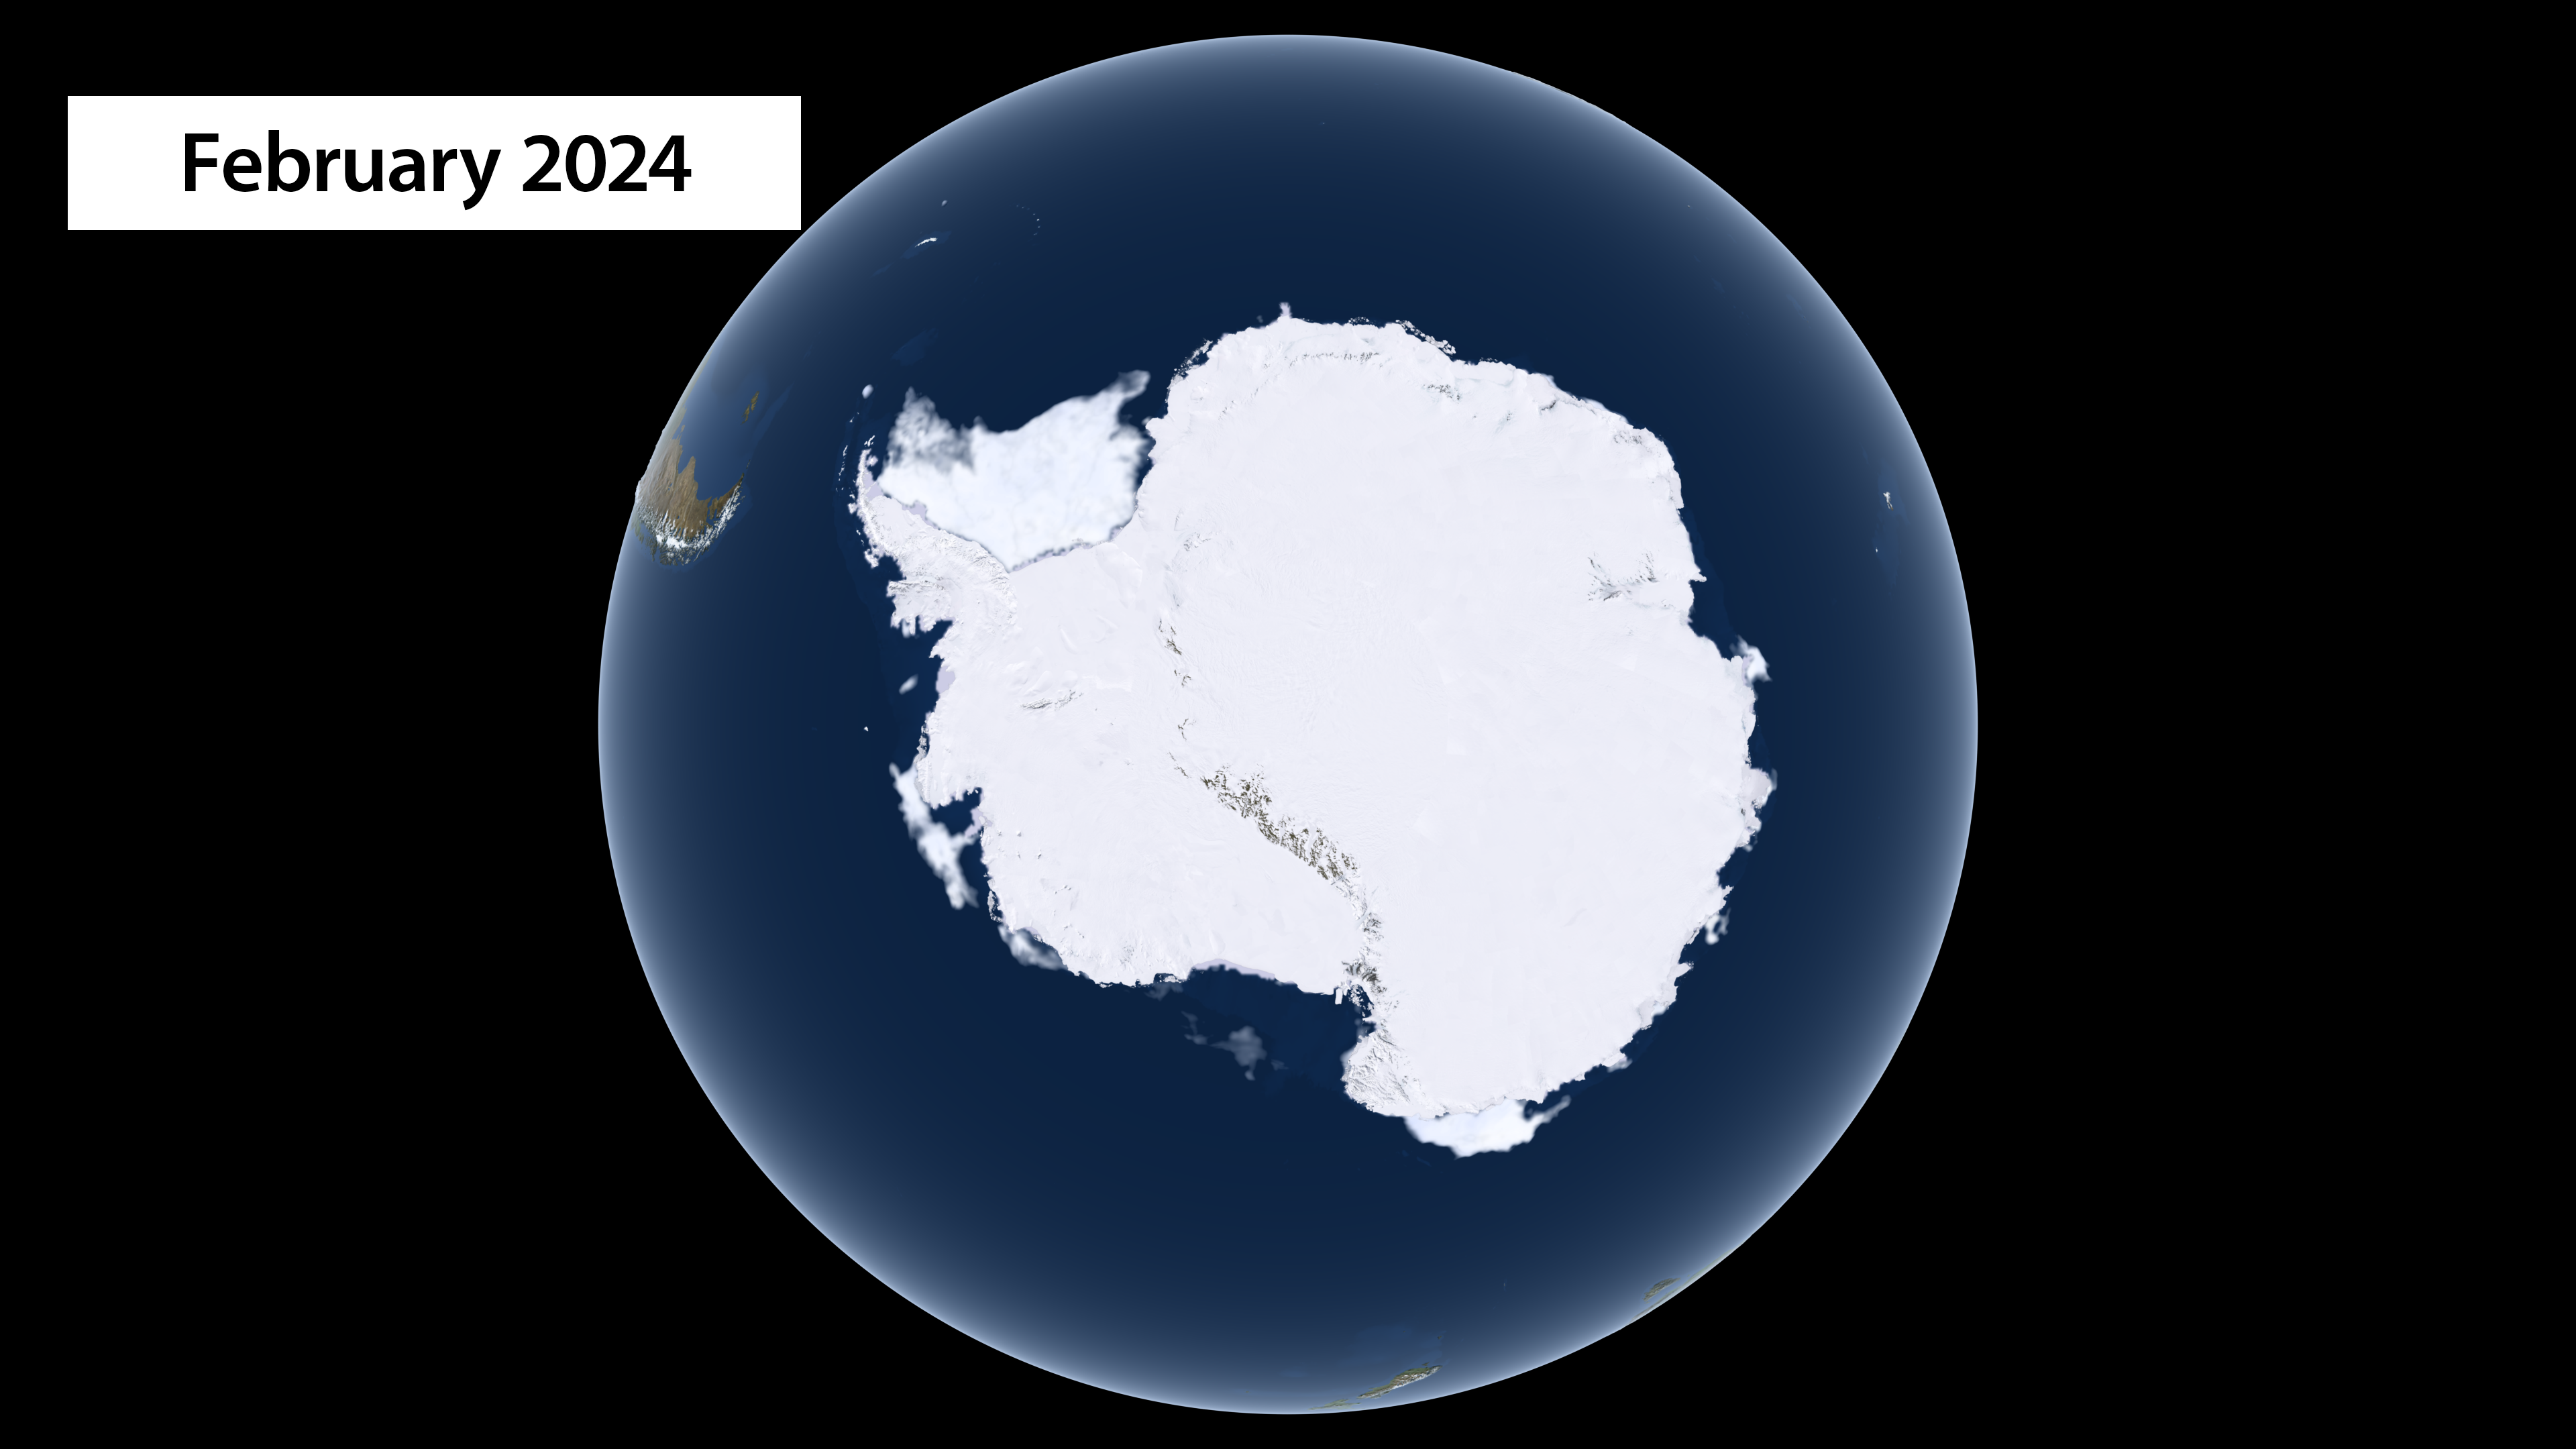
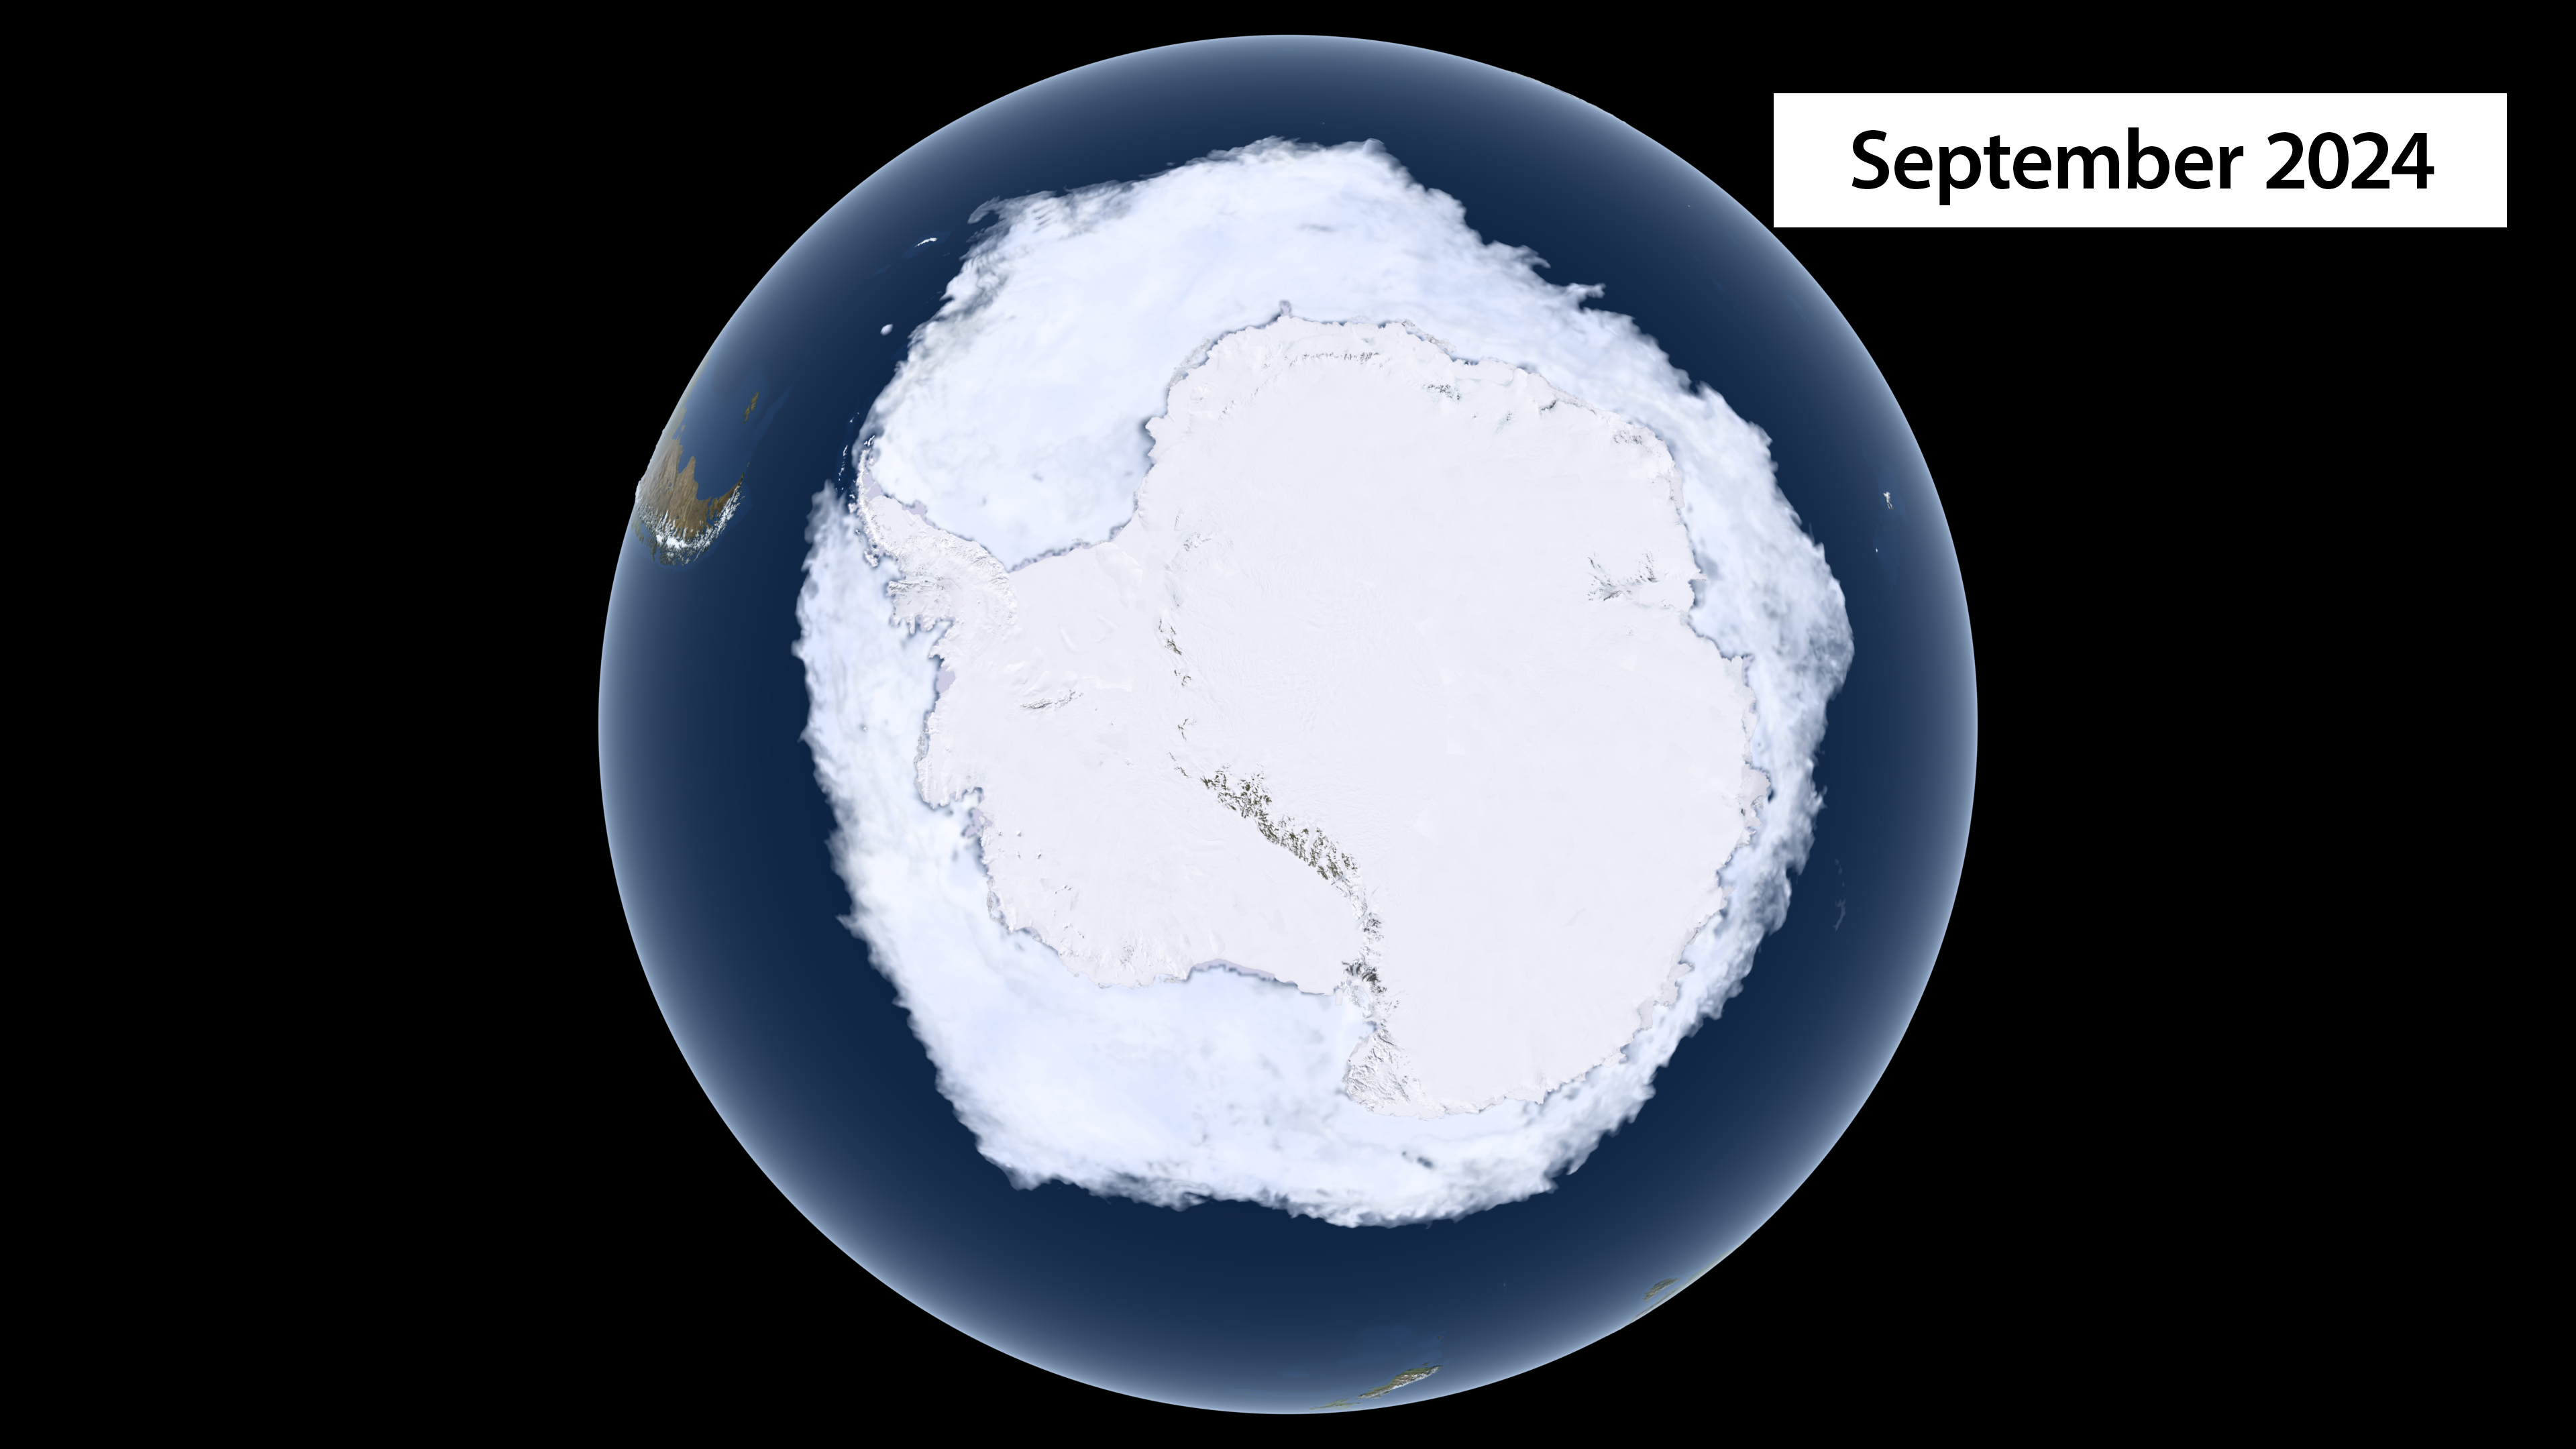
These maps from 2024 provide an example of how Antarctic sea ice coverage typically varies between the annual minimum and maximum.
Source: NASA, 20242
Web update: December 2024
Key Points
- Antarctic sea ice extent in September and February increased slightly over much of the period shown in Figure 1, but decreased in the last few years. The most recent measurements for September and February have been mostly below average (see Figure 1).
- The September maximum extent reached the lowest level on record in 2023, followed by 2024 and 1986; the highest level was in 2014. The February minimum extent reached a record low in 2023, followed by 2024 and 2022 (see Figure 1).
- Observed changes in Antarctic sea ice are small in comparison to the amount of sea ice that the Arctic has lost during the same period (see the Arctic Sea Ice indicator). Worldwide, the Earth lost sea ice at an average rate of 13,500 square miles per year from 1979 to 2014—equivalent to losing an area larger than the state of Maryland every year—and EPA’s indicators show that net loss has continued since then.4 This decrease affects the Earth’s energy balance.
Background
The Southern Ocean around Antarctica freezes to form sea ice every year. This sea ice typically reaches its maximum extent in September or early October, around the end of winter in the Southern Hemisphere. At that point, virtually the entire continent of Antarctica is surrounded by a ring of sea ice (see the following images). The ice melts in the summer months (December to February) because of warmer temperatures and long hours of sunlight. Unlike the Arctic, where a large area of sea ice lasts year-round (see the Arctic Sea Ice indicator), the sea ice around Antarctica is thinner and nearly all of it melts in a typical summer. This happens because no landmass is present to stop Antarctic sea ice from breaking up and drifting northward into warmer waters, where it eventually melts.
Like Arctic sea ice, Antarctic sea ice affects global climate, regional climate, and ecosystems. Because ice is more reflective than liquid water, it plays a significant role in maintaining the Earth’s energy balance and helping to keep polar regions cool. (For more information on how the color of the Earth's surface affects the absorption of sunlight, see the Snow Cover indicator.) Sea ice also keeps the air cool by forming a barrier between the cold air above and the warmer water below. Antarctic sea ice is an important part of the habitat for penguins, seals, and other animals.
Warmer air and ocean temperatures are generally expected to reduce the amount of sea ice present worldwide. While warming has already driven a noticeable decline in sea ice in the Arctic, extent in the Antarctic as a whole has not yet shown a long-term decline, which may reflect influences of wind patterns, ocean currents, and precipitation around the continent.1
About the Indicator
Figure 1 shows Antarctic sea ice extent from 1979, when routine monitoring by satellites started, to 2024. Sea ice extent is defined as the area of ocean where at least 15 percent of the surface is frozen. This threshold was chosen because scientists have found that it gives the best approximation of the edge of the ice. Data are collected throughout the year, but for comparison, this indicator focuses on the months when sea ice typically reaches its minimum and maximum extent. February is typically when the sea ice extent reaches its annual minimum after melting during the spring and summer. The ice typically reaches its maximum extent in late September or early October after winter freezing, with the largest monthly average extent occurring in September. However, in 2021, maximum extent occurred in August. Data for this indicator were gathered by the National Snow and Ice Data Center using satellite imaging technology and data processing methods developed by the National Aeronautics and Space Administration.
Unlike EPA’s Arctic Sea Ice indicator, this indicator does not show the age of Antarctic sea ice. This is because nearly all of the Antarctic ice melts every summer, unlike the Arctic, where a large portion of ice survives for multiple years.3
About the Data
Indicator Notes
Compared with the noticeable decrease in Arctic sea ice extent (see the Arctic Sea Ice indicator), the changes in Antarctic sea ice are small. Many factors appear to be influencing Antarctic sea ice extent, including changes in wind patterns and fresh water entering the ocean from melting ice sheets.6 For instance, a 2016 study showed that changes to atmospheric circulation patterns in the Antarctic region are responsible for increases in sea ice extent seen in some recent years.7 Without better ice thickness and ice volume estimates, it is difficult to characterize how the total amount of Antarctic sea ice is responding to climate change.1
Data Sources
The data for this indicator were provided by the National Snow and Ice Data Center, which produces a variety of reports analyzing sea ice. These data are also available online at: https://nsidc.org/data/seaice_index/data-and-image-archive.
Technical Documentation
References
1. IPCC (Intergovernmental Panel on Climate Change). (2019). Special report on the ocean and cryosphere in a changing climate. Cambridge University Press. www.ipcc.ch/srocc
2. NASA (National Aeronautics and Space Administration). (2024). Scientific Visualization Studio. https://svs.gsfc.nasa.gov
3. IPCC (Intergovernmental Panel on Climate Change). (2013). Climate change 2013—The physical science basis: Contribution of Working Group I to the Fifth Assessment Report of the Intergovernmental Panel on Climate Change (T. F. Stocker, D. Qin, G.-K. Plattner, M. Tignor, S. K. Allen, A. Boschung, A. Nauels, Y. Xia, V. Bex, & Midgley, Eds.). Cambridge University Press. www.ipcc.ch/report/ar5/wg1
4. Parkinson, C. L., Cavalieri, D. J., Gloersen, P., Zwally, H. J., & Comiso, J. C. (1999). Arctic sea ice extents, areas, and trends, 1978–1996. Journal of Geophysical Research: Oceans, 104(C9), 20837–20856. https://doi.org/10.1029/1999JC900082
5. NSIDC (National Snow and Ice Data Center). (2024). Sea ice index daily and monthly image viewer: Data archive. Retrieved December 12, 2024, from https://nsidc.org/data/seaice_index/data-and-image-archive
6. USGCRP (U.S. Global Change Research Program). (2017). Climate science special report: Fourth National Climate Assessment (NCA4), volume I (D. J. Wuebbles, D. W. Fahey, K. A. Hibbard, D. J. Dokken, B. C. Stewart, & T. K. Maycock, Eds.). https://doi.org/10.7930/J0J964J6
7. Meehl, G. A., Arblaster, J. M., Bitz, C. M., Chung, C. T. Y., & Teng, H. (2016). Antarctic sea-ice expansion between 2000 and 2014 driven by tropical Pacific decadal climate variability. Nature Geoscience, 9(8), 590–595. https://doi.org/10.1038/ngeo2751
Learn about other indicators in this section