Tracking Outcomes and Metrics to Measure Progress

In recent years, the Hypoxia Task Force has worked to set and report on metrics to help better track progress towards the hypoxic zone and nutrient loading reduction goals. This work is key to understanding whether the conservation actions that states and others are taking will help us reach the interim target of a 20% reduction in nitrogen and phosphorus delivered to the Gulf by 2025.
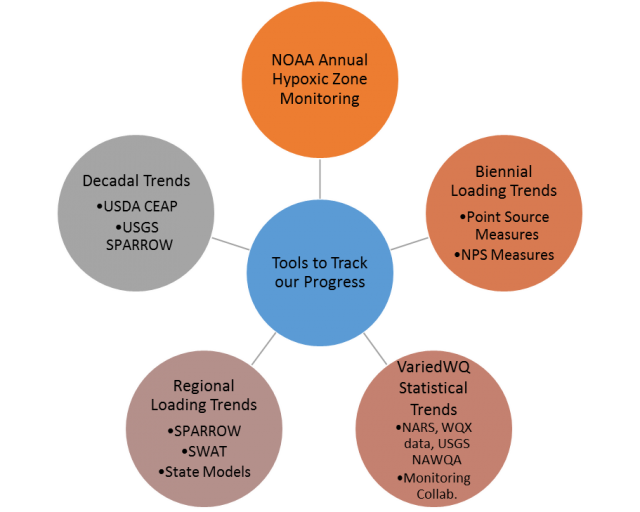
No one tool is perfect for measuring our progress because of the wide variety of factors that influence nutrient loading. Thus the Task Force and its partners are working to measure basin-wide nutrient reductions at multiple scales through multiple tools, including the following:
- A decadal look at conservation through the USDA-supported Conservation Effects Assessment Project (CEAP) and USGS-supported SPAtially Referenced Regression On Watershed attributes (SPARROW) efforts;
- State, regional and basin-scale loading models, including CEAP and SPARROW, that examine nutrients in the basin through source analyses;
- Statistical and other trend analyses of nutrient concentrations in the Mississippi/Atchafalaya River Basin (MARB) across multiple time-frames using data collected by states, USGS National Water Quality Assessment (NAWQA), EPA National Aquatic Resource Surveys (NARS), watershed groups, researchers, and those who use the Water Quality Portal for Nutrient Water Quality data (WQX) to house nutrient water quality data;
- Biennial reports on point and nonpoint source trend information; and
- The annual NOAA hypoxia zone monitoring cruise, which is a key tool of the Task Force to measure progress.
The Task Force presents progress and ongoing efforts regularly at annual public meetings. Details for upcoming meetings are updated on the public meeting webpage. Subscribe to Task Force Newsletters to receive quarterly updates on state and federal Task Force activities.
The Task Force has explored tools that can be used to further document progress. In 2020, the Task Force developed a compendium of tools to track conservation highlighting known technologies to track agricultural conservation in the United States.
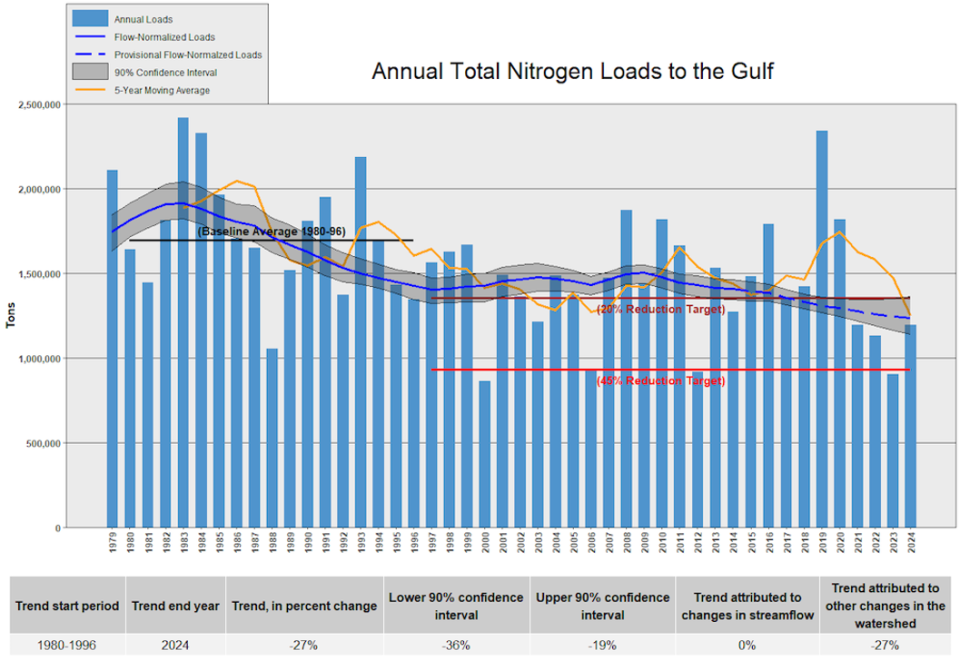
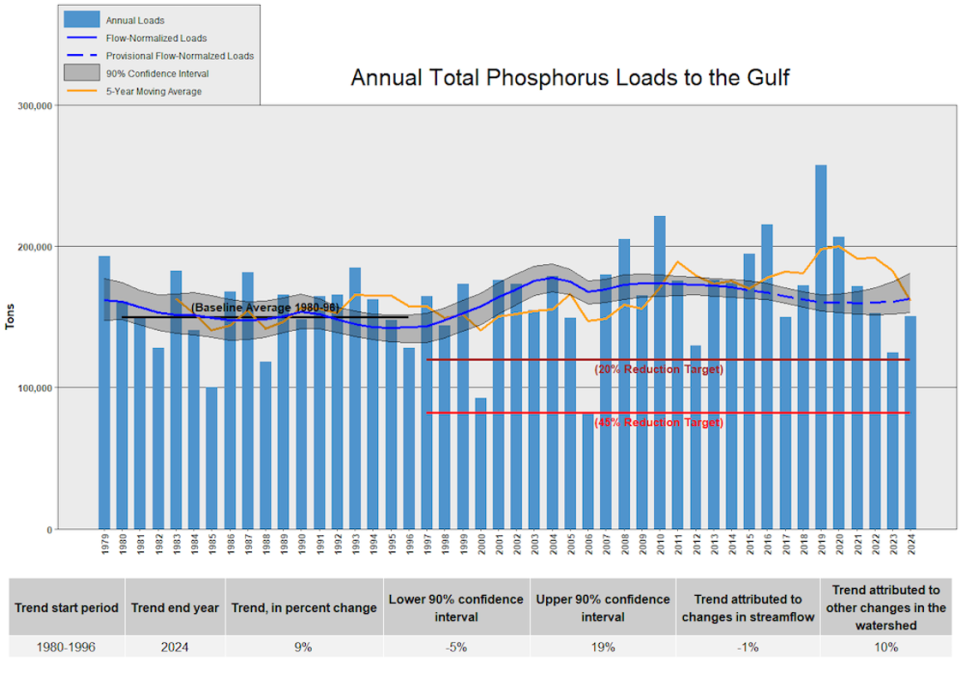
The Task Force tracks changes in nutrient loading from the MARB to the Gulf each year against the average total nitrogen and total phosphorus loads delivered to the Gulf during the baseline period from 1980 – 1996. To estimate these loads each year, the USGS uses the Weighted Regressions on Time, Discharge, and Season (WRTDS) methodology that 'normalizes' loads to average streamflow conditions. The WRTDS flow-normalized loads are a key metric used by the Task Force to evaluate progress towards nutrient reduction targets. Shown below are the WRTDS flow-normalize loads for total nitrogen and total phosphorus during the period from 1980 to 2024.


