Ports Primer: 6.2 Port Factors Impacting the Regional Economy


Ports support regional economies as well as local economies. Shifting trends in regional and international trade can have a significant impact on goods distribution patterns and therefore on regional economies. When port activity rises or falls, related business sectors, especially those in the goods movementThe distribution of freight (including raw materials, parts and finished consumer products) by all modes of transportation including marine, air, rail and truck. sector, can experience a ripple effect.
Suez Canal Expansion
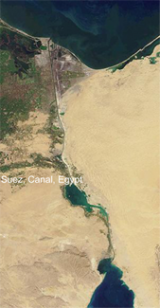
In 2015, Egypt completed an expansion of the Suez Canal, which connects the Mediterranean Sea to the Red Sea providing the shortest sea link between Asia and Europe. The expansion will allow for two-way traffic along part of the route and reduces transit time from 18 hours to 11 hours. More ship traffic through the Suez Canal is anticipated and could increase port activities at U.S. ports.1
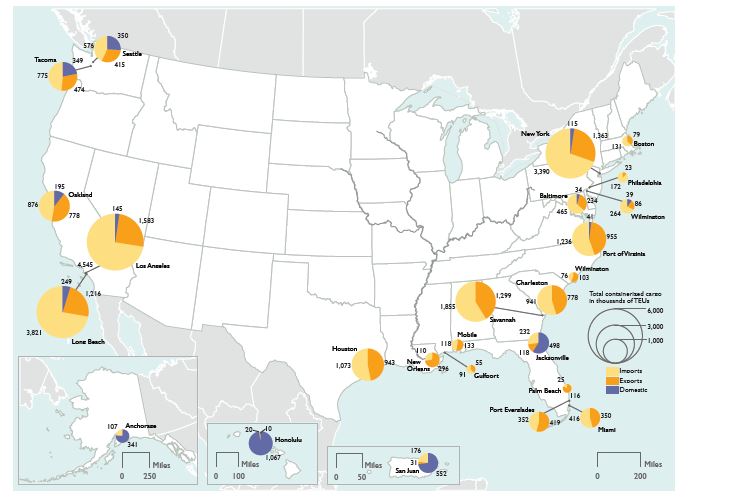
Top 25 U.S. Container Ports
The map below illustrates the top 25 container ports for U.S. international maritime freight.2 The pie chart for each port indicates both the level of cargo moving through a port and the ratio between importsCommodities of foreign origin entering the United States, as well as goods of domestic origin returned to the United States with no change in condition or after having been processed and/or assembled in other countries., exportsMerchandise transported out of the United States to foreign countries. and domestic cargo. The regional economies surrounding each of these ports can experience shifts as maritime trade increases or decreases.
Note: Cargo levels are measured in a unit called twenty-foot equivalentsA unit of measurement equal to the space occupied by a standard twenty-foot container. Used in stating the capacity of container vessel or storage area. One 40-foot container is equal to two TEUs. (TEUs). A TEU is equivalent to one 20-foot container.
Regional Shifts Related to International Trade Patterns
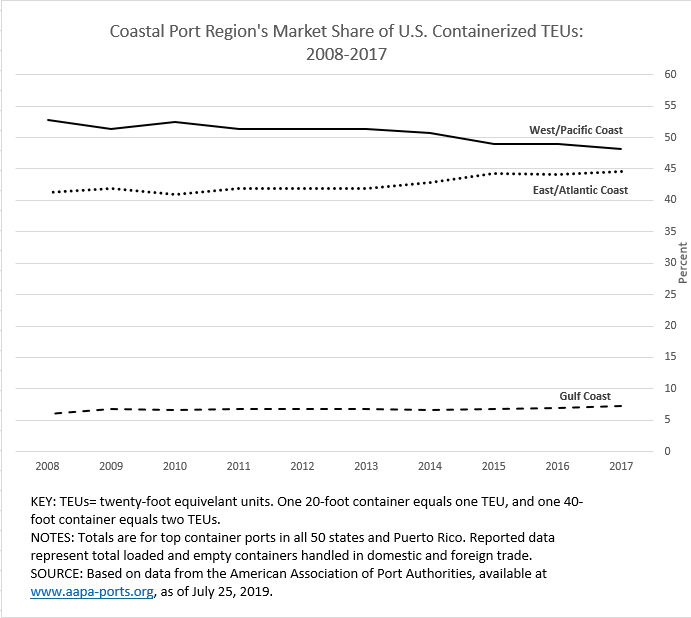
In the 1980s, the majority of international shipping traffic moved through east coast ports, but as trade with Asia has grown, the balance has shifted to favor west coast ports.3 However, with the the completion of the Panama Canal expansion, the market share of the east coast ports has increased since 2014. East coast ports are preparing for an influx of post-Panamax ships that will carry goods from Asia directly to the east coast. Gulf Coast ports have also recently expanded their share of container traffic as trade with Latin America grows.4 The chart below shows the shifts in market share of containerized cargo for coastal ports over time.5
Economic Impacts on Port-Related Industries6
Declines and increases in port container traffic can have a ripple effect on related industries, particularly industries associated with goods movement.
For example, in 2008, the U.S. Department of Transportation (DOT) found that maritime freight fell sharply at the end of the year. The decline hit west coast ports particularly hard; these ports experienced a 5 percent decline in containerized freight. The ripple effect impacted many industries including:
-

- Railroads and commercial trucking companies that service ports
- Inland warehouses and distribution centers
According to the DOT, the nation’s Class I railroadsDefined by the American Association of Railroads each year based on annual operating revenue. A railroad is dropped from the Class I list if it fails to meet the annual revenue threshold for three consecutive years. experienced a 7 percent decrease in international intermodal containers. Overall trucking activity also saw record declines.
Panama Canal Expansion
The expansion of the Panama Canal to accommodate larger ocean-going vessels, called post-Panamax ships, was completed in 2016. By 2030, post-Panamax vessels are projected to make up 62 percent of total container ship capacityThe available space for, or ability to handle, freight..7
Ports that decide they want to bring in post-Panamax vessels will need to consider investing in infrastructure such as dredgingThe process of removing sediment from harbor or river bottoms for safety purposes and to allow for deeper vessels., channel deepening and widening, and shore-side infrastructure to support these vessels.8 A port is considered ready to accept post-Panamax ships when it has:
- A channel depth of 50 feet with sufficient channel width and turning basin size
- Cranes capable of loading and unloading post-Panamax ships
- Docks engineered to handle the new bigger cranes.9
In addition, although some ports may be “post-panamax” ready on the water side, they may not be ready on the land side. Concerns and associated adjustments include traffic congestion, crane efficiency, container repositioning and overall terminal efficiency.
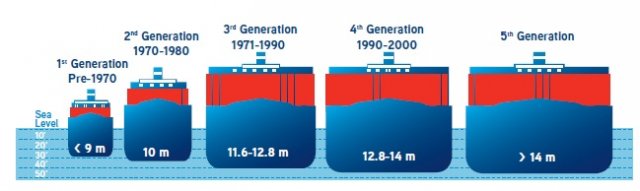
Which Ports will be Post-Panamax Ready?
The following U.S. Ports have completed upgrades or are currently upgrading to be post-Panamaz ready in the near future.10 The illustration below demonstrates the change in cargo vessels since the 1970s.11
- Baltimore
- Charleston
- Everglades
- Houston
- Jacksonville
- Los Angeles / Long Beach
- Miami
- Mobile
- New York / New Jersey
- Virginia
- Oakland
- Philadelphia
- Portland
- Savannah
- Seattle
- Tacoma
- Tampa