U.S. flag

An official website of the United States government

Here’s how you know

Dot gov

Official websites use .gov
A .gov website belongs to an official government organization in the United States.

HTTPS

Secure .gov websites use HTTPS
A lock (LockA locked padlock) or https:// means you’ve safely connected to the .gov website. Share sensitive information only on official, secure websites.

    • Environmental Topics
    • Air
    • Bed Bugs
    • Cancer
    • Chemicals, Toxics, and Pesticide
    • Emergency Response
    • Environmental Information by Location
    • Health
    • Land, Waste, and Cleanup
    • Lead
    • Mold
    • Radon
    • Research
    • Science Topics
    • Water Topics
    • A-Z Topic Index
    • Laws & Regulations
    • By Business Sector
    • By Topic
    • Compliance
    • Enforcement
    • Laws and Executive Orders
    • Regulations
    • Report a Violation
    • Environmental Violations
    • Fraud, Waste or Abuse
    • About EPA
    • Our Mission and What We Do
    • Headquarters Offices
    • Regional Offices
    • Labs and Research Centers
    • Planning, Budget, and Results
    • Organization Chart
    • EPA History

Breadcrumb

  1. Home
  2. Ports Initiative

Ports Primer: 8.1 Using Scientific Data and Research

Link to Home Page of Ports Primer for Communities
Link to Section 2, The Role of Ports
Link to Section 3, How Ports Work
Link to Section 4, Port-Community Relations
Link to Section 5.0, Land Use and Transportation
Link to Section 6, Local and Regional Economy
Link to Section 7, Environmental Impacts
Link to Section 8, Tools and Resources
Link to Section 9, Appendix
Link to Glossary for Ports Primer
Link to Endnotes for Ports Primer
On this page:
  • Bay Area Air Quality Management District: Local Data Analysis
  • Mapping and Data Tools Available to the Public
  • EJSCREEN
  • EnviroAtlas

Reminder

Check the Community Action Roadmap for a step-by-step process to apply the information in the Primer for building capacity and empowering communities.

Communities can demonstrate environmental concerns by providing scientific evidence of environmental impact. In some cases, communities may be able to access existing local data and conduct their own analyses by partnering with a local agency, organization or academic institution that collects raw data. Studies using local data are not common because of the high level of resources typically needed to collect the data. Additionally, technical support may be needed to conduct the data analysis desired by the community. However, when these resources are available, local data can be an extremely powerful tool. One example from the San Francisco Bay Area is provided below.

When local data are not available, communities may turn to existing studies to demonstrate the known and potential impacts of environmental conditions on human health and the environment. This approach can also be an effective tool for communicating the urgency to address the community’s environmental concerns.

Bay Area Air Quality Management District: Local Data Analysis

The Bay Area Air Quality Management District has done air quality analyses for regional land use and transportation planning as well as local air quality analyses for West Oakland, California. These analyses were conducted in the context of development of two Environmental Impact Reviews (EIRs) triggered by California Environmental Quality Act (CEQA) requirements. (CEQA is the state version of the National Environmental Policy Act (NEPA) and triggers development of EIRs, which are similar to the Environmental Impact Statements triggered by NEPA.)

These air quality analyses are available in the form of individual chapters of the respective EIRs. The methodologies might be adapted by other agencies or technical service providers partnering with local communities. To access the analyses, follow the links provided below:

  • West Oakland Specific Plan – Draft EIR, Section 4.2
  • Plan Bay Area 2040, Draft Environmental Impact Report, Section 2.2

Mapping and Data Tools Available to the Public

Numerous mapping and data tools are available to communities through a variety of sources. Some examples of the kind of information available:

  • Air quality data
  • Air quality nonattainment areas
  • Air Toxics
  • Population distribution and make-up
  • Locations where pollution is being or has been cleaned up
  • Transportation infrastructure
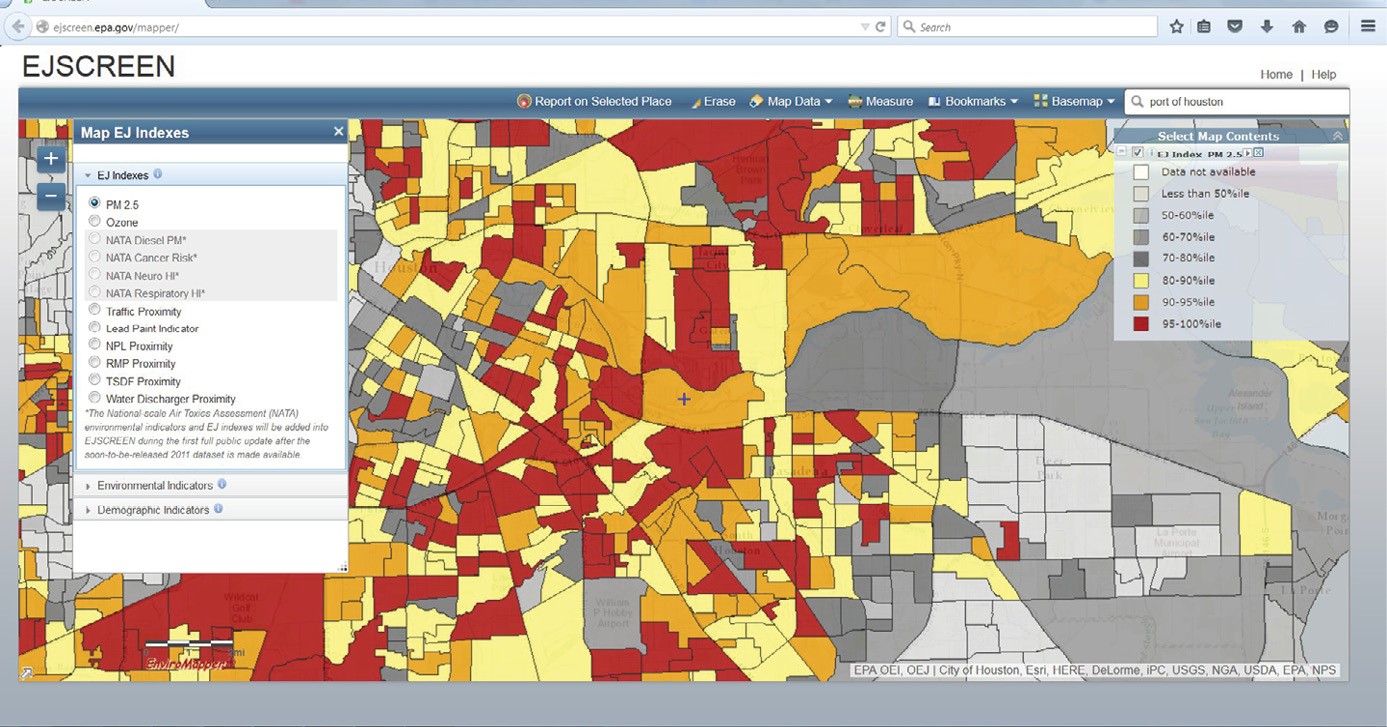
For more a more detailed list of mapping and data tools and considerations related to each, see Appendix A2.

EJSCREEN

Mapping and screening tool based on nationally consistent data that combines environmental and demographic indicators in maps and reports. This tool may support residents in highlighting environmental concerns in their communities.

For more information: EJScreen: Environmental Justice Screening and Mapping Tool

A map from EJSCREEN showing PM2.5 Index data on communities near the Port of Houston.
EJSCREEN displays PM2.5 Index data on communities around the Port of Houston.

EnviroAtlas

EnviroAtlas provides geospatial data, easy-to-use tools, and other resources related to the benefits that people receive from nature, their stressors and human health. Communities may benefit from working together to identify and evaluate issues and interpret EnviroAtlas maps and data.

The EnviroAtlas Interactive Map contains data such as EPA Regulated Facilities, Impaired Waters, demographic data, and in 2019 will also include the 2014 National Air Toxics Assessment (NATA) data. The EnviroAtlas Compare My Area Tool, planned for release in 2019, will allow users to select a location on a map and view summarized information for the area of interest and compare those values to surrounding county and state summarized values. Ambient air toxics concentrations, health risks associated with air toxics, the demographic make-up of an area, and watershed land cover characteristics will be available.

For more information:
  • EPA EnviroAtlas site
  • EnviroAtlas Interactive Map
  • EnviroAtlas Compare My Area Tool

« 8.0 Tools and Resources

Select to go forward or back.

                                                                                                            8.2 Citizen Science Projects »

Ports Initiative

  • About EPA Ports Initiative
  • Funding
    • Clean Ports Program
    • Funding Opportunities
    • Tips For a Successful Application
    • DERA Grants Awarded for Port Projects
  • Best Clean Air Practices
    • Case Studies
    • SmartWay
  • Technical Resources
    • Ports and Goods Movement Emission Inventories
    • National Port Strategy Assessment
    • EPA and Port Everglades Partnership
    • Shore Power Technology
  • Educational Events
  • Community-Port Collaboration
Contact Us About the EPA Ports Initiative
Contact Us to ask a question, provide feedback, or report a problem.
Last updated on March 28, 2025
  • Assistance
  • Spanish
  • Arabic
  • Chinese (simplified)
  • Chinese (traditional)
  • French
  • Haitian Creole
  • Korean
  • Portuguese
  • Russian
  • Tagalog
  • Vietnamese
United States Environmental Protection Agency

Discover.

  • Accessibility Statement
  • Budget & Performance
  • Contracting
  • EPA www Web Snapshot
  • Grants
  • No FEAR Act Data
  • Plain Writing
  • Privacy
  • Privacy and Security Notice

Connect.

  • Data
  • Inspector General
  • Jobs
  • Newsroom
  • Regulations.gov
  • Subscribe
  • USA.gov
  • White House

Ask.

  • Contact EPA
  • EPA Disclaimers
  • Hotlines
  • FOIA Requests
  • Frequent Questions
  • Site Feedback

Follow.