
Your Climate Adaptation Search
Integrated Package of Tailored Information:
Steps to Help You Prepare for the Impacts of Climate Change
-
Implications of Climate Change – Why does climate change matter for the things you care about?
Concerns:
-
Adaptation Strategies – What can you do about it?
IMAGE GOES HEREAdaptation strategies are provided below based upon your selected area(s) of interest and organized according to climate vulnerability and/or targeted climate threat. Select one of the categories below to open up a tab that contains a collection of adaptation strategies specific to that theme.
Strategies:
-
Case Studies – How can you replicate the successes other communities have had implementing the strategies?
IMAGE GOES HERECase Studies:
-
Tools – What tools are available to help you do it?
IMAGE GOES HERETools:
The above list is a subset of all EPA tools. To explore EPA Tools more fully, view Tools for Climate Change Adaptation.
-
Training – What training is available to build expertise?
Local Government Climate Adaptation Training – This training illustrates how a changing climate may affect a variety of environmental and public health services, such as providing safe drinking water and managing the effects of drought, fires, and floods.
-
Funding Opportunities – What financial support and technical assistance are available?
Climate adaptation helps ensure that community investments (e.g., water infrastructure) made with scarce taxpayer dollars are effective even as the climate changes. EPA recognizes that many communities face significant funding challenges making climate resilient planning and projects a reality.
EPA, and other federal agencies, are modernizing funding programs (e.g., Clean Water Act and Drinking Water State Revolving Funds, Brownfields Program; General Assistance Agreements for Tribes) to better encourage and support climate resilient investments.
To learn more about available funding and technical assistance, visit:
- Funding and Technical Assistance for Climate Adaptation
- EPA Climate Adaptation Funding
- Other EPA & Federal Funding Resources
- EPA Technical Assistance
-
EPA Contacts & State Websites – What EPA Regional staff are available for additional assistance? What information is available from your state?
Contact Information:
Additional Information about Climate Change in Your Region
Summary:
| Selection | Climate Change in Your Region Content | Adaptation Strategies | Case Studies | Tools | Training |
|---|---|---|---|---|---|
| Outdoor Air |
Outdoor Air Quality
|
Outdoor Air Quality
|
Outdoor Air Quality
The case studies highlight communities that have undertaken actions to adapt to climate risks. In each case study, information is provided on "How They Did It" and tools to help you replicate their actions. |
Outdoor Air Quality
EPA does not have climate change adaptation tools specifically developed for outdoor air. However, the following tools from other EPA programs are recommended to help communities prepare for the potential impacts of climate change and outdoor air.
|
|
| Ground Level Ozone |
Outdoor Air Quality: Ground-level Ozone
|
Outdoor Air Quality: Ground-level Ozone
|
Outdoor Air Quality: Ground-level Ozone
The case studies highlight communities that have undertaken actions to adapt to climate risks. In each case study, information is provided on "How They Did It" and tools to help you replicate their actions. |
Outdoor Air Quality: Ground-level Ozone
EPA does not have climate change adaptation tools specifically developed for outdoor air. However, the following tools from other EPA programs are recommended to help communities prepare for the potential impacts of climate change and outdoor air.
|
|
| Particulate Matter |
Outdoor Air Quality: Particulate Matter (PM)
Climate Change Implications to Particulate Matter (PM) Air Quality
Climate change may increase the levels of particulate matter which may increase public health risk. Worsening of wildfires and droughts may further exacerbate airborne particulate matter and may lead to public health risk.
|
Outdoor Air Quality: Particulate Matter (PM)
Climate change can increase particulate matter (PM) levels through increases in the frequency or intensity of wildfires. The following strategies represent voluntary outdoor air strategies that states and localities can pursue to help adapt to anticipated climate changes. |
Outdoor Air Quality: Particulate Matter (PM)
Here is an example of how one community is adapting to the potential of worsening air quality under a changing climate. California is anticipating a future that may include more human exposure to particulate matter due to more frequent and intense wildfires.
|
Outdoor Air Quality: Particulate Matter (PM)
EPA does not have climate change adaptation tools specifically developed for outdoor air. However, the following tools from other EPA programs are recommended to help communities prepare for the potential impacts of climate change and outdoor air.
|
|
| Outdoor Air + Ground Level Ozone |
Outdoor Air Quality: Ground-level Ozone
|
Outdoor Air Quality: Ground-level Ozone
|
Outdoor Air Quality: Ground-level Ozone
The case studies highlight communities that have undertaken actions to adapt to climate risks. In each case study, information is provided on "How They Did It" and tools to help you replicate their actions. |
Outdoor Air Quality: Ground-level Ozone
EPA does not have climate change adaptation tools specifically developed for outdoor air. However, the following tools from other EPA programs are recommended to help communities prepare for the potential impacts of climate change and outdoor air.
|
|
| Outdoor Air + Particulate Matter |
Outdoor Air Quality: Particulate Matter (PM)
|
Outdoor Air Quality: Particulate Matter (PM)
|
Outdoor Air Quality: Particulate Matter (PM)
The case studies highlight communities that have undertaken actions to adapt to climate risks. In each case study, information is provided on "How They Did It" and tools to help you replicate their actions. |
Outdoor Air Quality: Particulate Matter (PM)
EPA does not have climate change adaptation tools specifically developed for outdoor air. However, the following tools from other EPA programs are recommended to help communities prepare for the potential impacts of climate change and outdoor air.
|
|
| Outdoor Air + Particulate Matter + Ground Level Ozone |
Outdoor Air Quality: Particulate Matter (PM) and Ground-level Ozone
|
Outdoor Air Quality: Particulate Matter (PM) and Ground-level Ozone
|
Outdoor Air Quality: Particulate Matter (PM) and Ground-level Ozone
The case studies highlight communities that have undertaken actions to adapt to climate risks. In each case study, information is provided on "How They Did It" and tools to help you replicate their actions. |
Outdoor Air Quality: Particulate Matter (PM) and Ground-level Ozone
EPA does not have climate change adaptation tools specifically developed for outdoor air. However, the following tools from other EPA programs are recommended to help communities prepare for the potential impacts of climate change and outdoor air.
|
|
| Indoor Air + Outdoor Air |
Indoor Air Quality
Outdoor Air Quality
|
Air Quality
|
Outdoor Air Quality
The case studies highlight communities that have undertaken actions to adapt to climate risks. In each case study, information is provided on "How They Did It" and tools to help you replicate their actions.
Indoor Air Quality |
Indoor Air Quality
Outdoor Air Quality
EPA does not have climate change adaptation tools specifically developed for outdoor air. However, the following tools from other EPA programs are recommended to help communities prepare for the potential impacts of climate change and outdoor air.
|
|
| Indoor Air + Ground Level Ozone |
Indoor Air Quality
Outdoor Air Quality: Ground-level Ozone
|
Air Quality
|
Outdoor Air Quality
The case studies highlight communities that have undertaken actions to adapt to climate risks. In each case study, information is provided on "How They Did It" and tools to help you replicate their actions.
Indoor Air Quality |
Indoor Air Quality
Outdoor Air Quality
EPA does not have climate change adaptation tools specifically developed for outdoor air. However, the following tools from other EPA programs are recommended to help communities prepare for the potential impacts of climate change and outdoor air.
|
|
| Indoor Air + Outdoor Air + Ground Level Ozone |
Indoor Air Quality
Outdoor Air Quality: Ground-level Ozone
|
Air Quality
|
Outdoor Air Quality
The case studies highlight communities that have undertaken actions to adapt to climate risks. In each case study, information is provided on "How They Did It" and tools to help you replicate their actions.
Indoor Air Quality |
Indoor Air Quality
Outdoor Air Quality
EPA does not have climate change adaptation tools specifically developed for outdoor air. However, the following tools from other EPA programs are recommended to help communities prepare for the potential impacts of climate change and outdoor air.
|
|
| Indoor Air + Outdoor Air + Particulate Matter |
Indoor Air Quality
Outdoor Air Quality: Particulate Matter (PM)
|
Air Quality
|
Outdoor Air Quality
The case studies highlight communities that have undertaken actions to adapt to climate risks. In each case study, information is provided on "How They Did It" and tools to help you replicate their actions. Indoor Air Quality |
Indoor Air Quality
Outdoor Air Quality
EPA does not have climate change adaptation tools specifically developed for outdoor air. However, the following tools from other EPA programs are recommended to help communities prepare for the potential impacts of climate change and outdoor air.
|
|
| Indoor Air + Outdoor Air + Particulate Matter + Ground Level Ozone |
Indoor Air Quality
Outdoor Air Quality
|
Air Quality
|
Outdoor Air Quality
The case studies highlight communities that have undertaken actions to adapt to climate risks. In each case study, information is provided on "How They Did It" and tools to help you replicate their actions.
Indoor Air Quality |
Indoor Air Quality
Outdoor Air Quality
EPA does not have climate change adaptation tools specifically developed for outdoor air. However, the following tools from other EPA programs are recommended to help communities prepare for the potential impacts of climate change and outdoor air.
|
|
| Indoor Air |
Indoor Air Quality
|
Indoor Air Quality
|
Indoor Air Quality |
Indoor Air Quality
|
|
| Indoor Air + Particulate Matter |
Indoor Air Quality
Outdoor Air Quality: Particulate Matter (PM)
|
Air Quality
|
Outdoor Air Quality
The case studies highlight communities that have undertaken actions to adapt to climate risks. In each case study, information is provided on "How They Did It" and tools to help you replicate their actions. Indoor Air Quality |
Indoor Air Quality
Outdoor Air Quality
EPA does not have climate change adaptation tools specifically developed for outdoor air. However, the following tools from other EPA programs are recommended to help communities prepare for the potential impacts of climate change and outdoor air.
|
|
| Particulate Matter + Ground Level Ozone |
Outdoor Air Quality
|
Outdoor Air Quality
|
Outdoor Air Quality
The case studies highlight communities that have undertaken actions to adapt to climate risks. In each case study, information is provided on "How They Did It" and tools to help you replicate their actions. |
Outdoor Air Quality
EPA does not have climate change adaptation tools specifically developed for outdoor air. However, the following tools from other EPA programs are recommended to help communities prepare for the potential impacts of climate change and outdoor air.
|
|
| Indoor Air + Particulate Matter + Ground Level Ozone |
Indoor Air Quality
Outdoor Air Quality: Particulate Matter (PM)
|
Air Quality
|
Outdoor Air Quality
The case studies highlight communities that have undertaken actions to adapt to climate risks. In each case study, information is provided on "How They Did It" and tools to help you replicate their actions.
Indoor Air Quality |
Indoor Air Quality
Outdoor Air Quality
EPA does not have climate change adaptation tools specifically developed for outdoor air. However, the following tools from other EPA programs are recommended to help communities prepare for the potential impacts of climate change and outdoor air.
|
|
| Drought |
Water Utilities: Drought
|
Water Utilities: Drought
|
Water Utilities: Drought
The case studies highlight communities that have undertaken actions to adapt to climate risks. In each case study, information is provided on "How They Did It" and tools to help you replicate their actions.
|
Water Utilities: Drought
We identified several EPA tools below based on your interests. However, there are additional EPA tools that Water Utility representatives might find helpful depending on one's circumstances. We recommend checking out the EPA's more exhaustive list of these tools: Water Utility Tools.
|
Understanding Climate Change Impacts on Water Resources Training – Discusses the causes of climate change, its potential impacts on water resources, and the challenges water resource managers face. |
| Saltwater Intrusion |
Water Utilities: Saltwater Intrusion
|
Water Utilities: Saltwater Intrusion
*Note: Sea Level Rise and Drought may also worsen saltwater intrusion. View these adaptation strategies as well to gain a broader look at what adaptation strategies can better prepare a utility for saltwater intrusion. |
Water Utilities: Saltwater Intrusion
The case studies highlight communities that have undertaken actions to adapt to climate risks. In each case study, information is provided on "How They Did It" and tools to help you replicate their actions.
|
Water Utilities & Climate Adaptation
We identified several EPA tools below based on your interests. However, there are additional EPA tools that Water Utility representatives might find helpful depending on one's circumstances. We recommend checking out the EPA's more exhaustive list of these tools:
|
Understanding Climate Change Impacts on Water Resources Training – Discusses the causes of climate change, its potential impacts on water resources, and the challenges water resource managers face. |
| Sea-level Rise |
Water Utilities: Sea Level Rise
|
Water Utilities: Sea Level Rise
|
Water Utilities: Sea Level Rise
Here are three examples of how water utilities are adapting to potential climate vulnerabilities from sea level rise. This section also contains a third case study detailing how several communities in South Florida collaborated to better identify vulnerabilities from sea level rise.
|
Water Utilities & Climate Adaptation
We identified several EPA tools below based on your interests. However, there are additional EPA tools that Water Utility representatives might find helpful depending on one's circumstances. We recommend checking out the EPA's more exhaustive list of these tools:
|
Understanding Climate Change Impacts on Water Resources Training – Discusses the causes of climate change, its potential impacts on water resources, and the challenges water resource managers face. |
| Extreme Precipitation - Flooding |
Water Utilities: Storms
|
Water Utilities: Storms
|
Water Utilities: Storms
Here are three examples of how water utilities are adapting to potential climate vulnerabilities from storms.
|
Water Utilities & Climate Adaptation
We have identified several tools that may be of interest to you based on your selection. The direct link to these tools are provided below. However, to explore all tools that may be relevant to this selection view Water Utility Tools.
|
Understanding Climate Change Impacts on Water Resources Training – Discusses the causes of climate change, its potential impacts on water resources, and the challenges water resource managers face. |
| Source Water Impacts |
Water Utilities: Source Water Impacts
|
Water Utilities: Source Water Impacts
Note: Water Quality Adaptation Strategies provide additional adaptation strategies for water resource managers to help improve water quality and use green infrastructure to handle increased stormwater.
|
Water Utilities: Source Water Impacts
Here are three examples of how water utilities are adapting to potential climate change implications to source water quality.
To explore additional water utility case studies, view Water Utility Case Studies. |
Water Utilities & Climate Adaptation
We have identified several tools that may be of interest to you based on your selection. The direct link to these tools are provided below. However, to explore all tools that may be relevant to this selection view Water Utility Tools.
|
Understanding Climate Change Impacts on Water Resources Training – Discusses the causes of climate change, its potential impacts on water resources, and the challenges water resource managers face. |
| Drought + Saltwater Intrusion |
Water Utilities: Drought and Saltwater Intrusion
|
Water Utilities: Drought and Saltwater Intrusion
|
Water Utilities: Drought and Saltwater Intrusion
Here are two examples of water utilities that are adapting to anticipated climate vulnerabilities related to drought and saltwater intrusion. Tampa Bay diversified their water sources in order to reduce groundwater withdrawals and vulnerability to droughts. Anacortes rebuilt a water treatment facility to adapt to higher flood risk while analyzing the affect sea level rise would have on saltwater intrusion.
To explore additional water utility case studies, view Water Utility Case Studies. |
Water Utilities & Climate Adaptation
We have identified several tools that may be of interest to you based on your selection. The direct link to these tools are provided below. However, to explore all tools that may be relevant to this selection view Water Utility Tools.
|
Understanding Climate Change Impacts on Water Resources Training – Discusses the causes of climate change, its potential impacts on water resources, and the challenges water resource managers face. |
| Drought + Sea-level Rise |
Water Utilities: Drought and Sea Level Rise
|
Water Utilities: Drought and Sea Level Rise
|
Water Utilities: Drought and Sea Level Rise
Here are two examples of water utilities that are adapting to anticipated climate vulnerabilities related to drought and sea level rise.
To explore additional water utility case studies, view Water Utility Case Studies. |
Water Utilities & Climate Adaptation
We have identified several tools that may be of interest to you based on your selection. The direct link to these tools are provided below. However, to explore all tools that may be relevant to this selection view Water Utility Tools.
|
Understanding Climate Change Impacts on Water Resources Training – Discusses the causes of climate change, its potential impacts on water resources, and the challenges water resource managers face. |
| Drought + Extreme Precipitation - Flooding |
Water Utilities: Drought and Storms
|
Water Utilities: Drought and Storms
|
Water Utilities: Drought and Storms
Here are two examples of how water utilities are adapting to anticipated climate vulnerability from droughts and storms. Southern Nevada Water Authority analyzed how source water availability may be affected by drought or increased incidence of harmful algal blooms. Fredericktown, Missouri assessed drought risk, as well as the risk associated with strong storms that increase sedimentation and contaminate levels within a drinking water reservoir.
To explore additional water utility case studies, view Water Utility Case Studies. |
Water Utilities & Climate Adaptation
We have identified several tools that may be of interest to you based on your selection. The direct link to these tools are provided below. However, to explore all tools that may be relevant to this selection view Water Utility Tools.
|
Understanding Climate Change Impacts on Water Resources Training – Discusses the causes of climate change, its potential impacts on water resources, and the challenges water resource managers face. |
| Drought + Source Water Impacts |
Water Utilities: Drought and Source Water Impacts
|
Water Utilities: Drought and Source Water Impacts
|
Water Utilities: Drought and Source Water Impacts
Here are two examples of how water utilities are adapting to anticipated climate vulnerability of water sources from drought. Southern Nevada Water Authority analyzed how source water availability may be affected by drought and increased incidence of harmful algal blooms. Fredericktown, Missouri assessed drought risk and potential risk from increased sedimentation and contaminate levels within a drinking water reservoir.
To explore additional water utility case studies, view Water Utility Case Studies. |
Water Utilities & Climate Adaptation
We have identified several tools that may be of interest to you based on your selection. The direct link to these tools are provided below. However, to explore all tools that may be relevant to this selection view Water Utility Tools.
|
Understanding Climate Change Impacts on Water Resources Training – Discusses the causes of climate change, its potential impacts on water resources, and the challenges water resource managers face. |
| Drought + Saltwater Intrusion + Sea-level Rise |
Water Utilities: Drought, Sea Level Rise and Saltwater Intrusion
|
Water Utilities: Drought, Sea Level Rise and Saltwater Intrusion
|
Water Utilities: Drought, Sea Level Rise and Saltwater Intrusion
Here are two examples of water utilities that are adapting to anticipated climate vulnerabilities from drought, sea level rise and saltwater intrusion. Tampa Bay diversified water sources in order to reduce vulnerability to droughts and lessen groundwater withdrawals that worsen saltwater intrusion. Anacortes rebuilt a water treatment facility to adapt to higher flood risk while analyzing the affect sea level rise would have on saltwater intrusion.
To explore additional water utility case studies, view Water Utility Case Studies. |
Water Utilities & Climate Adaptation
We have identified several tools that may be of interest to you based on your selection. The direct link to these tools are provided below. However, to explore all tools that may be relevant to this selection view Water Utility Tools.
|
Understanding Climate Change Impacts on Water Resources Training – Discusses the causes of climate change, its potential impacts on water resources, and the challenges water resource managers face. |
| Drought + Saltwater Intrusion + Extreme Precipitation - Flooding |
Water Utilities: Drought, Storms and Saltwater Intrusion
|
Water Utilities: Drought, Storms and Saltwater Intrusion
|
Water Utilities: Drought, Storms and Saltwater Intrusion
Here are three examples of water utilities that are adapting to anticipated climate vulnerabilities related to drought, saltwater intrusion, and storms. Tampa Bay diversified their water sources in order to reduce vulnerability to droughts and lessen groundwater withdrawals. Anacortes rebuilt a water treatment facility to adapt to higher flood risk from storms while analyzing the risk from saltwater intrusion on the drinking water intake.
To explore additional water utility case studies, view Water Utility Case Studies. |
Water Utilities & Climate Adaptation
We have identified several tools that may be of interest to you based on your selection. The direct link to these tools are provided below. However, to explore all tools that may be relevant to this selection view Water Utility Tools.
|
Understanding Climate Change Impacts on Water Resources Training – Discusses the causes of climate change, its potential impacts on water resources, and the challenges water resource managers face. |
| Drought + Saltwater Intrusion + Source Water Impacts |
Water Utilities: Drought, Source Water Impacts and Saltwater Intrusion
|
Water Utilities: Drought, Source Water Impacts and Saltwater Intrusion
|
Water Utilities: Drought, Source Water Impacts and Saltwater Intrusion
Here are two examples of water utilities that are adapting to anticipated climate vulnerability of source waters from drought and saltwater intrusion. Tampa Bay diversified their water sources in order to reduce groundwater withdrawals and vulnerability to droughts. Anacortes rebuilt a water treatment facility to adapt to higher flood risk while analyzing the affect sea level rise and saltwater intrusion would have on source waters.
To explore additional water utility case studies, view Water Utility Case Studies. |
Water Utilities & Climate Adaptation
We have identified several tools that may be of interest to you based on your selection. The direct link to these tools are provided below. However, to explore all tools that may be relevant to this selection view Water Utility Tools.
|
Understanding Climate Change Impacts on Water Resources Training – Discusses the causes of climate change, its potential impacts on water resources, and the challenges water resource managers face. |
| Drought + Saltwater Intrusion + Sea-level Rise + Extreme Precipitation - Flooding |
Water Utilities: Drought, Saltwater Intrusion, Sea Level Rise and Storms
|
Water Utilities: Drought, Saltwater Intrusion, Sea Level Rise and Storms
|
Water Utilities: Drought, Saltwater Intrusion, Sea Level Rise and Storms
Here are four examples of water utilities that are adapting to anticipated climate vulnerabilities related to drought, saltwater intrusion, sea level rise and storms. Drought:
Saltwater Intrusion:
Sea Level Rise:
Storms:
To explore additional water utility case studies, view Water Utility Case Studies. |
Water Utilities & Climate Adaptation
We have identified several tools that may be of interest to you based on your selection. The direct link to these tools are provided below. However, to explore all tools that may be relevant to this selection view Water Utility Tools.
|
Understanding Climate Change Impacts on Water Resources Training – Discusses the causes of climate change, its potential impacts on water resources, and the challenges water resource managers face. |
| Saltwater Intrusion + Sea-level Rise |
Water Utilities: Saltwater Intrusion and Sea Level Rise
|
Water Utilities: Saltwater Intrusion and Sea Level Rise
|
Water Utilities: Saltwater Intrusion and Sea Level Rise
Here are two examples of water utilities that are adapting to anticipated climate vulnerabilities from sea level rise and saltwater intrusion. Tampa Bay diversified water sources in order to reduce groundwater withdrawals that worsen saltwater intrusion. Anacortes rebuilt a water treatment facility to adapt to higher flood risk while analyzing the affect sea level rise would have on saltwater intrusion.
To explore additional water utility case studies, view Water Utility Case Studies. |
Water Utilities & Climate Adaptation
We have identified several tools that may be of interest to you based on your selection. The direct link to these tools are provided below. However, to explore all tools that may be relevant to this selection view Water Utility Tools.
|
Understanding Climate Change Impacts on Water Resources Training – Discusses the causes of climate change, its potential impacts on water resources, and the challenges water resource managers face. |
| Saltwater Intrusion + Sea-level Rise + Source Water |
Water Utilities: Saltwater Intrusion, Sea Level Rise and Source Water Impacts
|
Water Utilities: Saltwater Intrusion, Sea Level Rise and Source Water Impacts
|
Water Utilities: Saltwater Intrusion, Sea Level Rise and Source Water Impacts
Here are two examples of water utilities that are adapting to anticipated climate vulnerabilities of source water from sea level rise and saltwater intrusion. Tampa Bay diversified water sources in order to reduce groundwater withdrawals that worsen saltwater intrusion. Anacortes rebuilt a water treatment facility to adapt to higher flood risk while analyzing the affect sea level rise would have on saltwater intrusion.
To explore additional water utility case studies, view Water Utility Case Studies. |
Water Utilities & Climate Adaptation
We have identified several tools that may be of interest to you based on your selection. The direct link to these tools are provided below. However, to explore all tools that may be relevant to this selection view Water Utility Tools.
|
Understanding Climate Change Impacts on Water Resources Training – Discusses the causes of climate change, its potential impacts on water resources, and the challenges water resource managers face. |
| Saltwater Intrusion + Source Water |
Water Utilities: Saltwater Intrusion and Source Water Impacts
|
Water Utilities: Saltwater Intrusion and Source Water Impacts
|
Water Utilities: Saltwater Intrusion and Source Water Impacts
Here are two examples of water utilities that are adapting to anticipated climate vulnerabilities of source water from saltwater intrusion. Tampa Bay diversified water sources in order to reduce groundwater withdrawals that worsen saltwater intrusion. Anacortes rebuilt a water treatment facility to adapt to higher flood risk while analyzing the affect sea level rise would have on saltwater intrusion.
To explore additional water utility case studies, view Water Utility Case Studies. |
Water Utilities & Climate Adaptation
We have identified several tools that may be of interest to you based on your selection. The direct link to these tools are provided below. However, to explore all tools that may be relevant to this selection view Water Utility Tools.
|
Understanding Climate Change Impacts on Water Resources Training – Discusses the causes of climate change, its potential impacts on water resources, and the challenges water resource managers face. |
| Drought + Saltwater Intrusion + Sea-level Rise + Source Water Impacts |
Water Utilities: Drought, Saltwater Intrusion, Sea Level Rise and Source Water Impacts
|
Water Utilities: Drought, Saltwater Intrusion, Sea Level Rise and Source Water Impacts
|
Water Utilities: Drought, Saltwater Intrusion, Sea Level Rise and Source Water Impacts
Here are four examples of water utilities that are adapting to anticipated climate vulnerabilities related to drought, saltwater intrusion, sea level rise and storms. Drought:
Saltwater Intrusion:
Sea Level Rise:
Source Water Impacts:
To explore additional water utility case studies, view Water Utility Case Studies. |
Water Utilities & Climate Adaptation
We have identified several tools that may be of interest to you based on your selection. The direct link to these tools are provided below. However, to explore all tools that may be relevant to this selection view Water Utility Tools.
|
Understanding Climate Change Impacts on Water Resources Training – Discusses the causes of climate change, its potential impacts on water resources, and the challenges water resource managers face. |
| Drought + Saltwater Intrusion + Extreme Precipitation - Flooding + Source Water Impacts |
Water Utilities: Drought, Saltwater Intrusion, Storms and Source Water Impacts
|
Water Utilities: Drought, Saltwater Intrusion, Storms and Source Water Impacts
|
Water Utilities: Drought, Saltwater Intrusion, Storms and Source Water Impacts
Here are examples of water utilities that are adapting to anticipated climate vulnerabilities related to each selected impact: drought, saltwater intrusion, sea level rise, storms and source water impacts. Drought:
Saltwater Intrusion:
Storms:
Source Water Impacts:
To explore additional water utility case studies, view Water Utility Case Studies. |
Water Utilities & Climate Adaptation
We have identified several tools that may be of interest to you based on your selection. The direct link to these tools are provided below. However, to explore all tools that may be relevant to this selection view Water Utility Tools.
|
Understanding Climate Change Impacts on Water Resources Training – Discusses the causes of climate change, its potential impacts on water resources, and the challenges water resource managers face. |
| Drought + Saltwater Intrusion + Sea-level Rise + Extreme Precipitation - Flooding + Source Water Impacts |
Water Utilities: Drought, Saltwater Intrusion, Sea Level Rise, Storms and Source Water Impacts
|
Water Utilities: Drought, Saltwater Intrusion, Sea Level Rise, Storms and Source Water Impacts
|
Water Utilities: Drought, Saltwater Intrusion, Sea Level Rise, Storms and Source Water Impacts
Here are examples of water utilities that are adapting to anticipated climate vulnerabilities related to each selected impact: drought, saltwater intrusion, sea level rise, storms and source water impacts. Drought:
Saltwater Intrusion:
Sea Level Rise:
Storms:
Source Water Impacts:
To explore additional water utility case studies, view Water Utility Case Studies. |
Water Utilities & Climate Adaptation
We have identified several tools that may be of interest to you based on your selection. The direct link to these tools are provided below. However, to explore all tools that may be relevant to this selection view Water Utility Tools.
|
Understanding Climate Change Impacts on Water Resources Training – Discusses the causes of climate change, its potential impacts on water resources, and the challenges water resource managers face. |
| Drought + Sea-level Rise + Extreme Precipitation - Flooding |
Water Utilities: Drought, Sea Level Rise and Storms
|
Water Utilities: Drought, Sea Level Rise and Storms
View Adaptation Strategies for Drought to see specific strategies that have been identified for water utilities. View Adaptation Strategies for Sea Level Rise to see specific strategies that have been identified for water utilities. Or, visit Water Utility Adaptation Strategies Section to search by management objective or other climate impact. |
Water Utilities: Drought, Sea Level Rise and Storms
Here are three examples of water utilities that are adapting to anticipated climate vulnerabilities from drought, sea level rise and storms.
|
Water Utilities & Climate Adaptation
We have identified several tools that may be of interest to you based on your selection. The direct link to these tools are provided below. However, to explore all tools that may be relevant to this selection view Water Utility Tools.
|
Understanding Climate Change Impacts on Water Resources Training – Discusses the causes of climate change, its potential impacts on water resources, and the challenges water resource managers face. |
| Drought + Sea-level Rise + Extreme Precipitation - Flooding + Source Water Impacts |
Water Utilities: Drought, Sea Level Rise, Storms and Source Water Impacts
|
Water Utilities: Drought, Sea Level Rise, Storms and Source Water Impacts
|
Water Utilities: Drought, Sea Level Rise, Storms and Source Water Impacts
Here are three examples of water utilities that are adapting to anticipated climate vulnerabilities from drought, sea level rise and storms.
To explore additional water utility case studies, view Water Utility Case Studies. |
Water Utilities & Climate Adaptation
We have identified several tools that may be of interest to you based on your selection. The direct link to these tools are provided below. However, to explore all tools that may be relevant to this selection view Water Utility Tools.
|
Understanding Climate Change Impacts on Water Resources Training – Discusses the causes of climate change, its potential impacts on water resources, and the challenges water resource managers face. |
| Drought + Sea-level Rise + Source Water Impacts |
Water Utilities: Drought, Sea Level Rise and Source Water Impacts
|
Water Utilities: Drought, Sea Level Rise and Source Water Impacts
|
Water Utilities: Drought, Sea Level Rise and Source Water Impacts
Here are three examples of water utilities that are adapting to anticipated climate vulnerabilities from drought, sea level rise and source water impacts.
To explore additional water utility case studies, view Water Utility Case Studies. |
Water Utilities & Climate Adaptation
We have identified several tools that may be of interest to you based on your selection. The direct link to these tools are provided below. However, to explore all tools that may be relevant to this selection view Water Utility Tools.
|
Understanding Climate Change Impacts on Water Resources Training – Discusses the causes of climate change, its potential impacts on water resources, and the challenges water resource managers face. |
| Sea-level Rise + Source Water Impacts |
Water Utilities: Sea Level Rise and Source Water Impacts
|
Water Utilities: Sea Level Rise and Source Water Impacts
|
Water Utilities: Sea Level Rise and Source Water Impacts
Here are three examples of water utilities that are adapting to anticipated climate vulnerabilities from sea level rise and source water impacts.
To explore additional water utility case studies, view Water Utility Case Studies. |
Water Utilities & Climate Adaptation
We have identified several tools that may be of interest to you based on your selection. The direct link to these tools are provided below. However, to explore all tools that may be relevant to this selection view Water Utility Tools.
|
Understanding Climate Change Impacts on Water Resources Training – Discusses the causes of climate change, its potential impacts on water resources, and the challenges water resource managers face. |
| Drought + Extreme Precipitation - Flooding + Source Water Impacts |
Water Utilities: Drought, Storms and Source Water Impacts
|
Water Utilities: Drought, Storms and Source Water Impacts
|
Water Utilities: Drought, Storms and Source Water Impacts
Here are three examples of water utilities that are adapting to anticipated climate vulnerabilities from drought, storms and source water impacts.
To explore additional water utility case studies, view Water Utility Case Studies. |
Water Utilities & Climate Adaptation
We have identified several tools that may be of interest to you based on your selection. The direct link to these tools are provided below. However, to explore all tools that may be relevant to this selection view Water Utility Tools.
|
Understanding Climate Change Impacts on Water Resources Training – Discusses the causes of climate change, its potential impacts on water resources, and the challenges water resource managers face. |
| Extreme Precipitation - Flooding + Saltwater Intrusion |
Water Utilities: Storms and Saltwater Intrusion
|
Water Utilities: Storms and Saltwater Intrusion
|
Water Utilities: Storms and Saltwater Intrusion
Here is one example of a water utility that is adapting to anticipated climate vulnerabilities from storms and saltwater intrusion.
To explore additional water utility case studies, view Water Utility Case Studies. |
Water Utilities & Climate Adaptation
We have identified several tools that may be of interest to you based on your selection. The direct link to these tools are provided below. However, to explore all tools that may be relevant to this selection view Water Utility Tools.
|
Understanding Climate Change Impacts on Water Resources Training – Discusses the causes of climate change, its potential impacts on water resources, and the challenges water resource managers face. |
| Extreme Precipitation - Flooding + Sea-level Rise |
Water Utilities: Storms and Sea Level Rise
|
Water Utilities: Storms and Sea Level Rise
|
Water Utilities: Storms and Sea Level Rise
Here are three examples of water utilities that are adapting to anticipated climate vulnerabilities from storms and sea level rise.
To explore additional water utility case studies, view Water Utility Case Studies. |
Water Utilities & Climate Adaptation
We have identified several tools that may be of interest to you based on your selection. The direct link to these tools are provided below. However, to explore all tools that may be relevant to this selection view Water Utility Tools.
|
Understanding Climate Change Impacts on Water Resources Training – Discusses the causes of climate change, its potential impacts on water resources, and the challenges water resource managers face. |
| Extreme Precipitation - Flooding + Source Water Impacts |
Water Utilities: Storms and Source Water Impacts
|
Water Utilities: Storms and Source Water Impacts
|
Water Utilities: Storms and Source Water Impacts
Here are three examples of water utilities that are adapting to anticipated climate vulnerabilities from storms impacting source water quality.
To explore additional water utility case studies, view Water Utility Case Studies. |
Water Utilities & Climate Adaptation
We have identified several tools that may be of interest to you based on your selection. The direct link to these tools are provided below. However, to explore all tools that may be relevant to this selection view Water Utility Tools.
|
Understanding Climate Change Impacts on Water Resources Training – Discusses the causes of climate change, its potential impacts on water resources, and the challenges water resource managers face. |
| Extreme Precipitation - Flooding + Saltwater Intrusion + Sea-level Rise |
Water Utilities: Storms, Saltwater Intrusion and Sea Level Rise
|
Water Utilities: Storms, Saltwater Intrusion and Sea Level Rise
|
Water Utilities: Storms, Saltwater Intrusion and Sea Level Rise
Here are two examples of water utilities that are adapting to anticipated climate vulnerabilities from storms, saltwater intrusion and sea level rise.
To explore additional water utility case studies, view Water Utility Case Studies. |
Water Utilities & Climate Adaptation
We have identified several tools that may be of interest to you based on your selection. The direct link to these tools are provided below. However, to explore all tools that may be relevant to this selection view Water Utility Tools.
|
Understanding Climate Change Impacts on Water Resources Training – Discusses the causes of climate change, its potential impacts on water resources, and the challenges water resource managers face. |
| Extreme Precipitation - Flooding + Saltwater Intrusion + Source Water Impacts |
Water Utilities: Storms, Saltwater Intrusion and Source Water Impacts
|
Water Utilities: Storms, Saltwater Intrusion and Source Water Impacts
|
Water Utilities: Storms, Saltwater Intrusion and Source Water Impacts
Here are two examples of water utilities that are adapting to anticipated climate risk of storms and saltwater intrusion adversely affecting source water quality.
To explore additional water utility case studies, view Water Utility Case Studies. |
Water Utilities & Climate Adaptation
We have identified several tools that may be of interest to you based on your selection. The direct link to these tools are provided below. However, to explore all tools that may be relevant to this selection view Water Utility Tools.
|
Understanding Climate Change Impacts on Water Resources Training – Discusses the causes of climate change, its potential impacts on water resources, and the challenges water resource managers face. |
| Extreme Precipitation - Flooding + Saltwater Intrusion + Sea-level Rise + Source Water Impacts |
Water Utilities: Storms, Saltwater Intrusion, Sea Level Rise and Source Water Impacts
|
Water Utilities: Storms, Saltwater Intrusion, Sea Level Rise and Source Water Impacts
|
Water Utilities: Storms, Saltwater Intrusion, Sea Level Rise and Source Water Impacts Storms:
Saltwater Intrusion:
Sea Level Rise:
Source Water Impacts:
To explore additional water utility case studies, view Water Utility Case Studies. |
Water Utilities & Climate Adaptation
We have identified several tools that may be of interest to you based on your selection. The direct link to these tools are provided below. However, to explore all tools that may be relevant to this selection view Water Utility Tools.
|
Understanding Climate Change Impacts on Water Resources Training – Discusses the causes of climate change, its potential impacts on water resources, and the challenges water resource managers face. |
| Extreme Precipitation - Flooding + Sea-level Rise + Source Water Impacts |
Water Utilities: Storms, Sea Level Rise and Source Water Impacts
|
Water Utilities: Storms, Sea Level Rise and Source Water Impacts
|
Water Utilities: Storms, Sea Level Rise and Source Water Impacts
Here are examples of water utilities that are adapting to anticipated climate vulnerabilities related to each selected impact: storms, sea level rise, and source water impacts. Storms:
Sea Level Rise:
Source Water Impacts:
To explore additional water utility case studies, view Water Utility Case Studies. |
Water Utilities & Climate Adaptation
We have identified several tools that may be of interest to you based on your selection. The direct link to these tools are provided below. However, to explore all tools that may be relevant to this selection view Water Utility Tools.
|
Understanding Climate Change Impacts on Water Resources Training – Discusses the causes of climate change, its potential impacts on water resources, and the challenges water resource managers face. |
| Erosion and Sedimentation |
Water Quality: Erosion and Sedimentation Rates
|
Water Quality: Erosion and Sedimentation Rates
|
Water Quality: Erosion and Sedimentation Rates
Here are two examples of how water resource managers are adapting to maintain water quality even under changing climate conditions.
|
Water Quality & Climate Adaptation For a view at the projected changes (2035 and 2060) for your region and how they may impact stormwater runoff, such as the anticipated intensity of the 100 year storm, view:
To model erosion and sedimentation anticipated under future climate scenarios, view:
|
Understanding Climate Change Impacts on Water Resources Training – Discusses the causes of climate change, its potential impacts on water resources, and the challenges water resource managers face. |
| Algal Blooms |
Water Quality: Harmful Algal Blooms
|
Water Quality: Harmful Algal Blooms
|
Water Quality: Harmful Algal Blooms
Here is an example of how water resource managers are adapting to reduce future occurrences of harmful algal blooms under changing climate conditions.
|
Water Quality & Climate Adaptation To model water quality changes and contributors to harmful algal bloom outbreaks, view:
Also for more information on the affects of climate change on incidence of harmful algal blooms, view:
|
Understanding Climate Change Impacts on Water Resources Training – Discusses the causes of climate change, its potential impacts on water resources, and the challenges water resource managers face. |
| Stormwater Runoff |
Water Quality: Stormwater Runoff
|
Water Quality: Stormwater Runoff
|
Water Quality: Stormwater Runoff
Here are four examples of how water resource managers adapting to limit stormwater runoff and maintain water quality even as the climate changes.
|
Water Quality & Climate Adaptation To model climate risks to urban runoff from a municipal or community-level, view:
To model stormwater runoff and the benefits of green infrastructure from a property or small-scale level, view:
For a view at the projected changes (2035 and 2060) for your region and how they may impact stormwater runoff, such as the anticipated intensity of the 100 year storm, view:
|
Understanding Climate Change Impacts on Water Resources Training – Discusses the causes of climate change, its potential impacts on water resources, and the challenges water resource managers face. |
| Erosion and Sedimentation + Algal Blooms |
Water Quality: Harmful Algal Blooms and Erosion and Sedimentation Rates
|
Water Quality: Harmful Algal Blooms and Erosion and Sedimentation Rates
|
Water Quality: Harmful Algal Blooms and Erosion and Sedimentation Rates
Here are three examples of how water resource managers are adapting to limit the impacts of erosion and sedimentation on water quality even as the climate changes.
|
Water Quality & Climate Adaptation To model water quality changes and contributors to harmful algal bloom outbreaks, view:
Also for more information on the affects of climate change on incidence of harmful algal blooms, view:
To model erosion and sedimentation anticipated under future climate scenarios, view:
|
Understanding Climate Change Impacts on Water Resources Training – Discusses the causes of climate change, its potential impacts on water resources, and the challenges water resource managers face. |
| Algal Blooms + Stormwater Runoff |
Water Quality: Stormwater Runoff and Harmful Algal Blooms
|
Water Quality: Stormwater Runoff and Harmful Algal Blooms
|
Water Quality: Stormwater Runoff and Harmful Algal Blooms
Here are three examples of how water resource managers are adapting to reduce stormwater runoff, limit harmful algal blooms and maintain water quality even as the climate changes.
|
Water Quality & Climate Adaptation For a view at the projected changes (2035 and 2060) for your region and how they may impact stormwater runoff, such as the anticipated intensity of the 100 year storm, view:
To model climate risks to urban runoff from a municipal or community-level, view:
To model water quality changes and contributors to harmful algal bloom outbreaks, view:
Also for more information on climate changes, such as increased rainfall, and the affect that these changes have on stormwater runoff and incidence of harmful algal blooms, view:
|
Understanding Climate Change Impacts on Water Resources Training – Discusses the causes of climate change, its potential impacts on water resources, and the challenges water resource managers face. |
| Stormwater Runoff + Erosion and Sedimentation |
Water Quality: Stormwater Runoff and Erosion and Sedimentation Rates
|
Water Quality: Stormwater Runoff and Erosion and Sedimentation Rates
|
Water Quality: Stormwater Runoff and Erosion and Sedimentation Rates Stormwater:
Erosion and Sedimentation:
|
Water Quality & Climate Adaptation For a view at the projected changes (2035 and 2060) for your region and how they may impact stormwater runoff, such as the anticipated intensity of the 100 year storm, view:
To model climate risks to urban runoff from a municipal or community-level, view:
To model erosion and sedimentation anticipated under future climate scenarios, view:
|
Understanding Climate Change Impacts on Water Resources Training – Discusses the causes of climate change, its potential impacts on water resources, and the challenges water resource managers face. |
| Erosion and Sedimentation + Algal Blooms + Stormwater Runoff |
Water Quality: Stormwater Runoff, Erosion and Sedimentation Rates, and Harmful Algal Blooms
|
Water Quality: Stormwater Runoff, Erosion and Sedimentation Rates, and Harmful Algal Blooms
|
Water Quality: Stormwater Runoff, Erosion and Sedimentation Rates, and Harmful Algal Blooms Stormwater:
Erosion and Sedimentation:
Harmful Algal Blooms:
|
Water Quality & Climate Adaptation For a view at the projected changes (2035 and 2060) for your region and how they may impact stormwater runoff, such as the anticipated intensity of the 100 year storm, view:
To model climate risks to urban runoff from a municipal or community-level, view:
To model erosion and sedimentation anticipated under future climate scenarios, view:
To model water quality changes and contributors to harmful algal bloom outbreaks, view:
|
Understanding Climate Change Impacts on Water Resources Training – Discusses the causes of climate change, its potential impacts on water resources, and the challenges water resource managers face. |
| Change in Fish Species |
Ecosystem Protection: Change in Fish Species
|
Ecosystem Protection: Change in Fish Species
Adaptation Strategies that can help fish species adapt to a changing climate include: |
Ecosystem Protection: Change in Fish Species
Here are two examples of communities adapting to reduce the vulnerability of fish species to climate change.
To explore additional case studies, view Ecosystem Protection Case Studies. |
Ecosystem Protection & Climate Adaptation
We have identified several tools that may be of interest to you based on your selection. The direct link to these tools are provided below. However, to explore all tools that may be relevant to this selection view Ecosystem Protection Tools.
Other resources that may be of interest:
|
Understanding Climate Change Impacts on Water Resources Training – Discusses the causes of climate change, its potential impacts on water resources, and the challenges water resource managers face. |
| Estuaries |
Ecosystem Protection: Estuaries
|
Ecosystem Protection: Estuaries
Adaptation Strategies for Estuaries include: |
Ecosystem Protection: Estuaries
Here are two examples of how communities and National Estuary Programs are adapting to reduce the vulnerability of estuaries to changing climate conditions.
To explore additional case studies, view Ecosystem Protection Case Studies. |
Ecosystem Protection & Climate Adaptation
We have identified several tools that may be of interest to you based on your selection. The direct link to these tools are provided below. However, to explore all tools that may be relevant to this selection view Ecosystem Protection Tools.
Other resources that may be of interest:
|
Understanding Climate Change Impacts on Water Resources Training – Discusses the causes of climate change, its potential impacts on water resources, and the challenges water resource managers face. |
| Wetland Protection |
Ecosystem Protection: Wetlands Protection
|
Ecosystem Protection: Wetlands Protection
|
Ecosystem Protection: Wetlands Protection
Here are three examples of how communities are adapting to prepare wetlands for changing climate conditions.
To explore additional case studies, view Ecosystem Protection Case Studies. |
Ecosystem Protection & Climate Adaptation
We have identified several tools that may be of interest to you based on your selection. The direct link to these tools are provided below. However, to explore all tools that may be relevant to this selection view Ecosystem Protection Tools.
Other resources that may be of interest:
|
Understanding Climate Change Impacts on Water Resources Training – Discusses the causes of climate change, its potential impacts on water resources, and the challenges water resource managers face. |
| Change in Fish Species + Estuaries |
Ecosystem Protection: Change in Fish Species and Estuaries
|
Ecosystem Protection: Change in Fish Species and Estuaries
Adaptation Strategies for Estuaries include:
Adaptation Strategies that can help fish species adapt to a changing climate |
Ecosystem Protection: Change in Fish Species and Estuaries
Here are three examples of how communities are adapting to better prepare fish species and estuaries for changing climate conditions.
To explore additional case studies, view Ecosystem Protection Case Studies. |
Ecosystem Protection & Climate Adaptation
We have identified several tools that may be of interest to you based on your selection. The direct link to these tools are provided below. However, to explore all tools that may be relevant to this selection view Ecosystem Protection Tools.
|
Understanding Climate Change Impacts on Water Resources Training – Discusses the causes of climate change, its potential impacts on water resources, and the challenges water resource managers face. |
| Change in Fish Species + Wetland Protection |
Ecosystem Protection: Change in Fish Species and Wetlands Protection
|
Ecosystem Protection: Change in Fish Species and Wetlands Protection
|
Ecosystem Protection: Change in Fish Species and Wetlands Protection
Here are three examples of how communities are adapting to better prepare fish species and wetlands for changing climate conditions.
To explore additional case studies, view Ecosystem Protection Case Studies. |
Ecosystem Protection & Climate Adaptation
Other resources that may be of interest:
|
Understanding Climate Change Impacts on Water Resources Training – Discusses the causes of climate change, its potential impacts on water resources, and the challenges water resource managers face. |
| Change in Fish Species + Estuaries + Wetland Protection |
Ecosystem Protection: Change in Fish Species, Estuaries, and Wetlands Protection
|
Ecosystem Protection: Change in Fish Species, Estuaries, and Wetlands Protection
|
Ecosystem Protection: Change in Fish Species, Estuaries, and Wetlands Protection
Here are two examples of how communities are adapting to better prepare estuaries, fish species and wetlands for changing climate conditions.
To explore additional case studies, view Ecosystem Protection Case Studies. |
Ecosystem Protection & Climate Adaptation
We have identified several tools that may be of interest to you based on your selection. The direct link to these tools are provided below. However, to explore all tools that may be relevant to this selection view Ecosystem Protection Tools.
Other resources that may be of interest:
|
Understanding Climate Change Impacts on Water Resources Training – Discusses the causes of climate change, its potential impacts on water resources, and the challenges water resource managers face. |
| Estuaries + Wetland Protection |
Ecosystem Protection: Estuaries and Wetlands Protection
|
Ecosystem Protection: Estuaries and Wetlands Protection
|
Ecosystem Protection: Estuaries and Wetlands Protection
Here are two examples of how communities and National Estuary Programs are adapting to better prepare estuaries and wetlands for changing climate conditions.
To explore additional case studies, view Ecosystem Protection Case Studies. |
Ecosystem Protection & Climate Adaptation
We have identified several tools that may be of interest to you based on your selection. The direct link to these tools are provided below. However, to explore all tools that may be relevant to this selection view Ecosystem Protection Tools.
Other resources that may be of interest:
|
Understanding Climate Change Impacts on Water Resources Training – Discusses the causes of climate change, its potential impacts on water resources, and the challenges water resource managers face. |
| Contaminated Site Management |
Waste and Emergency Management: Contaminated Site Management
|
Waste and Emergency Management: Contaminated Site Management
|
Waste and Emergency Management: Contaminated Site Management
Below are two climate change adaptation cases to illustrate adaptation-in-action at waste management and contaminated land sites. The first case, American Cyanamid, illustrates adaptation actions to make a waste site more resilient to future storms. The second case, Barre City, discusses how a community is including future climatic considerations in its redevelopment efforts.
To explore additional examples of climate adaptation, view Case Studies for Climate Change Adaptation |
Waste Management and Emergency Response & Climate Adaptation
EPA does not have climate change adaptation tools specifically developed for waste management activities. However, the following tools are recommended to help account for potential climate change impacts at contaminated waste sites.
|
|
| Disaster Debris Management |
Waste and Emergency Management: Disaster Debris Management
|
Waste and Emergency Management: Disaster Debris Management
With climate change, the frequency and intensity of storms are expected to increase in many areas. Large amounts of disaster debris is typically generated during such storms. Planning has been identified as an adaptation strategy. |
Waste and Emergency Management: Disaster Debris Management
|
Waste and Emergency Management: Disaster Debris Management
EPA does not have climate change adaptation tools specifically developed for disaster debris management activities. However, the following tools are recommended to help communities prepare for the potential of more frequent and intense storms.
|
|
| Contaminated Site Management + Disaster Debris Management |
Waste Management and Emergency Response
Climate change can threaten the proper management of wastes and complicate the safe management of disaster debris. Potential vulnerabilities include damage to waste management facilities, accidental chemical releases, and the challenges associated with managing more disaster debris more frequently. Waste and Emergency Management: Contaminated Site Management and Disaster Debris Management
|
Waste and Emergency Management: Contaminated Site Management and Disaster Debris Management Adaptation Strategies for Contaminated Site Management:
Adaptation Strategies for Disaster Debris Management:
|
Waste and Emergency Management: Contaminated Site Management and Disaster Debris Management
Below are climate change adaptation cases to illustrate adaptation-in-action at waste management and contaminated land sites. The first case, American Cyanamid, illustrates adaptation actions to make a waste site more resilient to future storms. The second case, Barre City, discusses how a community is including future climatic considerations in its redevelopment efforts.
To explore additional examples of climate adaptation, view Case Studies for Climate Change Adaptation |
Waste and Emergency Management & Climate Adaptation
EPA does not have climate change adaptation tools specifically developed for waste management sites or disaster debris management activities. However, the following tools are recommended to help communities prepare for the potential impacts of climate change.
|
|
| Air Quality Indoor & Outdoor |
Public Health: Air Quality
|
Public Health: Air Quality
|
Public Health: Air Quality
Climate change impacts including rising temperatures, storm pattern changes, more extreme weather events, and rising sea levels can affect environmental related public health stressors. Below are several examples of climate change adaptation related to air quality and public health.
View the Case Studies for Climate Change Adaptation to explore additional examples of climate adaptation. |
Public Health & Climate Adaptation
The following tools may be helpful to you as you anticipate, prepare for and adapt to the public health risks of climate change. The tools were not developed specifically to address public health climate change concerns. However, they present analytical tools or can help organize information that might help public health officials better understand, plan for, or target potential climate change vulnerabilities.
For additional tools and information related to climate change and public health, we recommend visiting the links:
|
|
| Water Quality |
Public Health: Water Quality & Chemical Exposure from Flooding
|
Public Health: Water Quality & Chemical Exposure from Flooding
|
Public Health: Water Quality & Chemical Exposure from Flooding
Climate change impacts including rising temperatures, storm pattern changes, more extreme weather events, and rising sea levels can affect environmental related public health stressors. Below are several examples of climate change adaptation related to air quality and public health. The two examples illustrate how public health agencies can incorporated climate adaptation planning into their activities.
View the Case Studies for Climate Change Adaptation to explore additional examples of climate adaptation. |
Public Health & Climate Adaptation
The following tools may be helpful to you as you anticipate, prepare for and adapt to the public health risks of climate change. The tools were not developed specifically to address public health climate change concerns. However, they present analytical tools or can help organize information that might help public health officials better understand, plan for, or target potential climate change vulnerabilities.
For additional tools and information related to climate change and public health, we recommend visiting the links:
|
|
| Extreme Heat |
Public Health: Extreme Heat
|
Public Health: Extreme Heat
|
Public Health: Extreme Heat
Climate change impacts including rising temperatures, storm pattern changes, more extreme weather events, and rising sea levels can affect enviromental related public health stressors. Several examples of communities adapting to the threat of more frequent extreme heat events are provided below.
View the Case Studies for Climate Change Adaptation to explore additional examples of climate adaptation. |
Public Health & Climate Adaptation
The following tools may be helpful to you as you anticipate, prepare for and adapt to the public health risks of climate change. The tools were not developed specifically to address public health climate change concerns. However, they present analytical tools or can help organize information that might help public health officials better understand, plan for, or target potential climate change vulnerabilities.
For additional tools and information related to climate change and public health, we recommend visiting the links:
|
|
| Air Quality Indoor & Outdoor + Water Quality |
Public Health: Air Quality & Water Quality
|
Public Health: Air Quality & Water Quality
|
Public Health: Air Quality & Water Quality
Climate change impacts including rising temperatures, storm pattern changes, more extreme weather events, and rising sea levels can affect enviromental related public health stressors. States and local communities are anticipating, preparing for, and adapting to public health concerns related to climate change. Below are several examples of adaptation activities related to possible air quality and extreme heat public health impacts. Massachusetts and Minnesota have taken steps to better understand the climate change risks to public health, including air and water quality related impacts.
Here are three examples of adaptation efforts targeting air quality related risks.
View Case Studies for Climate Change Adaptation to explore additional examples of climate adaptation. |
Public Health & Climate Adaptation
The following tools may be helpful to you as you anticipate, prepare for and adapt to the public health risks of climate change. The tools were not developed specifically to address public health climate change concerns. However, they present analytical tools or can help organize information that might help public health officials better understand, plan for, or target potential climate change vulnerabilities.
For additional tools and information related to climate change and public health, we recommend visiting the links:
|
|
| Air Quality Indoor & Outdoor + Extreme Heat |
Public Health: Air Quality & Extreme Heat
|
Public Health: Air Quality & Extreme Heat
|
Public Health: Air Quality & Extreme Heat State-Level Public Health Planning:
Air Quality:
Extreme Heat:
View the Case Studies for Climate Change Adaptation to explore additional examples of climate adaptation. |
Public Health & Climate Adaptation
The following tools may be helpful to you as you anticipate, prepare for and adapt to the public health risks of climate change. The tools were not developed specifically to address public health climate change concerns. However, they present analytical tools or can help organize information that might help public health officials better understand, plan for, or target potential climate change vulnerabilities.
For additional tools and information related to climate change and public health, we recommend visiting the links:
|
|
| Water Quality + Extreme Heat |
Public Health: Water Quality & Extreme Heat
|
Public Health: Water Quality & Extreme Heat
|
Public Health: Water Quality & Extreme Heat Water Quality & Extreme Heat:
Extreme Heat:
View the Case Studies for Climate Change Adaptation to explore additional examples of climate adaptation. |
Public Health & Climate Adaptation
The following tools may be helpful to you as you anticipate, prepare for and adapt to the public health risks of climate change. The tools were not developed specifically to address public health climate change concerns. However, they present analytical tools or can help organize information that might help public health officials better understand, plan for, or target potential climate change vulnerabilities.
For additional tools and information related to climate change and public health, we recommend visiting the links:
|
|
| Air Quality Indoor & Outdoor + Water Quality + Extreme Heat |
Public Health: Air Quality, Water Quality & Extreme Heat
|
Public Health: Air Quality, Water Quality & Extreme Heat
|
Public Health: Air Quality, Water Quality & Extreme Heat State-Level Public Health Planning:
Air Quality:
Extreme Heat:
View the Case Studies for Climate Change Adaptation to explore additional examples of climate adaptation. |
Public Health & Climate Adaptation
The following tools may be helpful to you as you anticipate, prepare for and adapt to the public health risks of climate change. The tools were not developed specifically to address public health climate change concerns. However, they present analytical tools or can help organize information that might help public health officials better understand, plan for, or target potential climate change vulnerabilities.
For additional tools and information related to climate change and public health, we recommend visiting the links:
|
|
| Getting Started |
Adaptation Planning: Getting Started
There is no "one-size fits all" approach for communities to anticipate, plan, and adapt.
The U.S. Climate Resilience Toolkit is a great place to learn more and begin your adaptation planning efforts.
See a couple of alternative ways communities have organized their efforts.
|
Adaptation Planning: Getting Started
The U.S. Climate Resilience Toolkit provides useful adaptation planning strategies for communities. The site includes resources (e.g., data, tools, case studies) from across the federal government to help communities put their plans into action. |
Adaptation Planning: Getting Started
A number of communities have found it advantageous to work collaboratively with neighboring communities to advance their adaptation planning goals.
|
Adaptation Planning & Climate Adaptation
|
|
| Comprehensive |
Adaptation Planning: Comprehensive Planning
A number of local governments have found planning and assessing vulnerability across the broad range of government services as an effective approach to anticipate, plan for, and adapt. The U.S. Climate Resilience Toolkit is a great resource to help your adaptation planning efforts.
|
Adaptation Planning: Comprehensive Planning
The U.S. Climate Resilience Toolkit provides useful adaptation planning strategies for communities. The site includes resources (e.g., data, tools, case studies) from across the federal government to help communities put their plans into action. |
Adaptation Planning: Comprehensive Planning
A number of communities have found it advantageous to work collaboratively with neighboring communities to advance their adaptation planning goals.
|
Adaptation Planning & Climate Adaptation
|
|
| Sector-Based |
Adaptation Planning: Sector-Based Planning
There is no "one-size fits all" approach for communities to anticipate, plan, and adapt to the changing climate. A number of local governments have found focusing on a particular sector (e.g., Water Utility) as a practical way to make progress.
The U.S. Climate Resilience Toolkit is a great resource to help your adaptation planning efforts.
|
Adaptation Planning: Sector-Based Planning
The U.S. Climate Resilience Toolkit provides useful adaptation planning strategies for communities. The site includes resources (e.g., data, tools, case studies) from across the federal government to help communities put their plans into action. |
Adaptation Planning: Sector-Based Planning
|
Adaptation Planning & Climate Adaptation
|
|
| Getting Started + Comprehensive |
Adaptation Planning
Getting Started
There is no "one-size fits all" approach for communities to anticipate, plan, and adapt. The U.S. Climate Resilience Toolkit is a great place to learn more and begin your adaptation planning efforts.
Comprehensive Planning
A number of local governments have found planning and assessing vulnerability across the broad range of government services as an effective approach to anticipate, plan for, and adapt. |
Adaptation Planning
The U.S. Climate Resilience Toolkit provides useful adaptation planning strategies for communities. The site includes resources (e.g., data, tools, case studies) from across the federal government to help communities put their plans into action. |
Adaptation Planning
A number of communities have found it advantageous to work collaboratively with neighboring communities to advance their adaptation planning goals.
|
Adaptation Planning & Climate Adaptation
|
|
| Getting Started + Sector-Based |
Adaptation Planning
Getting Started
There is no "one-size fits all" approach for communities to anticipate, plan, and adapt. The U.S. Climate Resilience Toolkit is a great place to learn more and begin your adaptation planning efforts.
Sector-Based Adaptation Planning
A number of local governments have found focusing on a particular sector (e.g., Water Utility) as a practical way to make progress. |
Adaptation Planning
The U.S. Climate Resilience Toolkit provides useful adaptation planning strategies for communities. The site includes resources (e.g., data, tools, case studies) from across the federal government to help communities put their plans into action. |
Adaptation Planning
A number of communities have found it advantageous to work collaboratively with neighboring communities to advance their adaptation planning goals.
Sector Based:
|
Adaptation Planning & Climate Adaptation
|
|
| Comprehensive + Sector-Based |
Adaptation Planning
The U.S. Climate Resilience Toolkit is a great place to learn more and begin your adaptation planning efforts.
Comprehensive Adaptation Planning
A number of local governments have found planning and assessing vulnerability across the broad range of government services as an effective approach to anticipate, plan for, and adapt. Sector-Based Adaptation Planning
A number of local governments have found focusing on a particular sector (e.g., Water Utility) as a practical way to make progress. |
Adaptation Planning
The U.S. Climate Resilience Toolkit provides useful adaptation planning strategies for communities. The site includes resources (e.g., data, tools, case studies) from across the federal government to help communities put their plans into action. |
Adaptation Planning
A number of communities have found it advantageous to work collaboratively with neighboring communities to advance their adaptation planning goals.
Sector Based:
|
Adaptation Planning & Climate Adaptation
|
|
| Getting Started + Comprehensive + Sector-Based |
Adaptation Planning
Getting Started
There is no "one-size fits all" approach for communities to anticipate, plan, and adapt. The U.S. Climate Resilience Toolkit is a great place to learn more and begin your adaptation planning efforts.
Comprehensive Planning
A number of local governments have found planning and assessing vulnerability across the broad range of government services as an effective approach to anticipate, plan for, and adapt. Sector-Based Planning
A number of local governments have found focusing on a particular sector (e.g., Water Utility) as a practical way to make progress. |
Adaptation Planning
The U.S. Climate Resilience Toolkit provides useful adaptation planning strategies for communities. The site includes resources (e.g., data, tools, case studies) from across the federal government to help communities put their plans into action. |
Adaptation Planning
A number of communities have found it advantageous to work collaboratively with neighboring communities to advance their adaptation planning goals.
Sector Based:
|
Adaptation Planning & Climate Adaptation
The U.S. Climate Resilience Toolkit provides a useful five-step process that outlines steps that communities can take to identify, assess, and confront their climate vulnerabilities. The site also provides resources (e.g., data, tools, case studies) from across the federal government to help communities put the process into action. EPA Sector Based Tools:
|
| region | summary | contacts | contacts2 | factsheet | ||||||||||||||||||||||||||||||||||||||||||||||||||||
|---|---|---|---|---|---|---|---|---|---|---|---|---|---|---|---|---|---|---|---|---|---|---|---|---|---|---|---|---|---|---|---|---|---|---|---|---|---|---|---|---|---|---|---|---|---|---|---|---|---|---|---|---|---|---|---|---|
| NE |
The Northeast is projected to experience increased precipitation, more frequent and intense storms, and higher average temperatures. These projected changes pose challenges to communities as they protect water and waste infrastructure, maintain water quality, and protect air quality and public health. Many communities are building resilience to the risks they face under current climatic conditions. Use the links below for additional information about:
|
|
You selected the National Climate Assessment's Northeast Region. Below you can find an EPA regional climate adaptation contact, EPA Regional Climate Adaptation Implementation Plan (2014), and state climate adaptation website corresponding to your location. States and territories covered by EPA regions are provided to help you identify localized information. EPA Region 1(States served by EPA Region 1 - Connecticut, Maine, Massachusetts, New Hampshire, Rhode Island, Vermont and 10 Tribal Nations)
EPA Region 2(States served by EPA Region 2 - New Jersey, New York, Puerto Rico, US Virgin Islands and eight Tribal Nations)
EPA Region 3(States served by EPA Region 3 - Delaware, District of Columbia, Maryland, Pennsylvania, Virginia, West Virginia and one Tribal Nation)
|
How Communities in the Northeast are Adapting 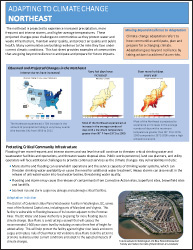
|
||||||||||||||||||||||||||||||||||||||||||||||||||||
| WA |
The Northwest is projected to experience changes in the timing of streamflow that will reduce water supplies for competing demands. Sea level rise, erosion, inundation, risks to infrastructure, and increasing ocean acidity pose major threats. Increasing wildfire, insect outbreaks, and tree diseases are causing widespread tree die-off. Use the links below for additional information about:
|
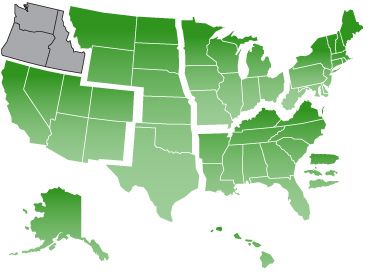
|
You selected the National Climate Assessment's Northwest Region. Below you can find an EPA regional climate adaptation contact, EPA Regional Climate Adaptation Implementation Plan (2014), and state climate adaptation website corresponding to your location. States and territories covered by EPA regions are provided to help you identify localized information. EPA Region 10(States served by EPA Region 10 - Alaska, Idaho, Oregon, Washington, and 271 Tribal Nations)
|
How Communities in the Northwest are Adapting 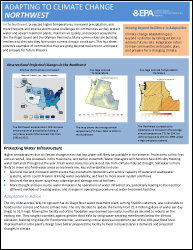
|
||||||||||||||||||||||||||||||||||||||||||||||||||||
| GA |
The southeast region is projected to experience higher average temperatures, increased precipitation, and more frequent and intense storms. These projected changes pose challenges to communities as they diversify water source, protect sensitive wetlands and protect people from heat waves. Climate impacts vary from a wet northern area to a dry southwest area. Use the links below for additional information about:
|
|
You selected the National Climate Assessment's Southeast-Caribbean Region. Below you can find an EPA regional climate adaptation contact, EPA Regional Climate Adaptation Implementation Plan (2014), and state climate adaptation website corresponding to your location. States and territories covered by EPA regions are provided to help you identify localized information. EPA Region 2(States served by EPA Region 2 - New Jersey, New York, Puerto Rico, US Virgin Islands and eight Tribal Nations)
EPA Region 3(States served by EPA Region 3 - Delaware, District of Columbia, Maryland, Pennsylvania, Virginia, West Virginia and one Tribal Nation)
EPA Region 4(States served by EPA Region 4 - Alabama, Florida, Georgia, Kentucky, Mississippi, North Carolina, South Carolina, Tennessee and six Tribal Nations)
EPA Region 6(States served by EPA Region 6 - Arkansas, Louisiana, New Mexico, Oklahoma, Texas and 66 Tribal Nations)
|
How Communities in the Southeast are Adapting 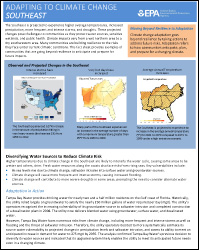
|
||||||||||||||||||||||||||||||||||||||||||||||||||||
| IL |
The Midwest is projected to experience extreme heat, heavy downpours, and flooding that will affect infrastructure, health, agriculture, forestry, transportation, air and water quality, and more. Climate change will also exacerbate a range of risks to the Great Lakes. Use the links below for additional information about:
|
|
You selected the National Climate Assessment's Midwest Region. Below you can find an EPA regional climate adaptation contact, EPA Regional Climate Adaptation Implementation Plan (2014), and state climate adaptation website corresponding to your location. States and territories covered by EPA regions are provided to help you identify localized information. EPA Region 5(States served by EPA Region 5 - Illinois, Indiana, Michigan, Minnesota, Ohio, Wisconsin and 35 Tribal Nations)
EPA Region 7(States served by EPA Region 7 - Iowa, Kansas, Missouri, Nebraska and nine Tribal Nations)
|
How Communities in the Midwest are Adapting 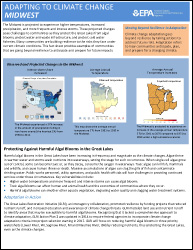
|
||||||||||||||||||||||||||||||||||||||||||||||||||||
| HI |
The Hawai'i and Pacific Islands are projected to experience warmer oceans leading to increased coral bleaching and disease outbreaks and changing distribution of tuna fisheries. Freshwater supplies will become more limited on many islands. Coastal flooding and erosion will increase. Mounting threats to food and water security, infrastructure, health, and safety are expected to lead to increasing human migration. Use the links below for additional information about:
|
|
You selected the National Climate Assessment's Hawai'i & Pacific Islands Region. Below you can find an EPA regional climate adaptation contact, EPA Regional Climate Adaptation Implementation Plan (2014), and state climate adaptation website corresponding to your location. States and territories covered by EPA regions are provided to help you identify localized information. EPA Region 9(States served by EPA Region 9 - Arizona, California, Hawai'i, Nevada, Pacific Islands and 148 Tribal Nations)
|
How Communities in Hawai'i and Pacific Islands are Adapting 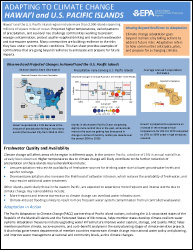
|
||||||||||||||||||||||||||||||||||||||||||||||||||||
| AK |
Alaska has warmed twice as fast as the rest of the nation, bringing widespread impacts. Sea ice is rapidly receding and glaciers are shrinking. Thawing permafrost is leading to more wildfire, and affecting infrastructure and wildlife habitat. Rising ocean temperatures and acidification will alter valuable marine fisheries. Use the links below for additional information about:
|
|
You selected the National Climate Assessment's Alaska Region. Below you can find an EPA regional climate adaptation contact, EPA Regional Climate Adaptation Implementation Plan (2014), and state climate adaptation website corresponding to your location. States and territories covered by EPA regions are provided to help you identify localized information. EPA Region 10(States served by EPA Region 10 - Alaska, Idaho, Oregon, Washington, and 271 Tribal Nations)
|
How Communities in Alaska are Adapting 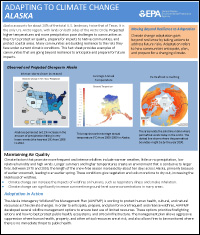
|
||||||||||||||||||||||||||||||||||||||||||||||||||||
| KS |
The Great Plains is projected to experience rising temperatures leading to increased demand for water and energy. In parts of the region, this will constrain development, stress natural resources, and increase competition for water. New agricultural practices will be needed to cope with changing conditions. Use the links below for additional information about:
|
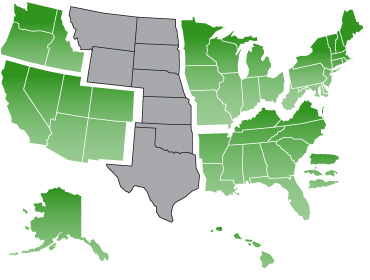
|
You selected the National Climate Assessment's Great Plains Region. Below you can find an EPA regional climate adaptation contact, EPA Regional Climate Adaptation Implementation Plan (2014), and state climate adaptation website corresponding to your location. States and territories covered by EPA regions are provided to help you identify localized information. EPA Region 6(States served by EPA Region 6 - Arkansas, Louisiana, New Mexico, Oklahoma, Texas and 66 Tribal Nations)
EPA Region 7(States served by EPA Region 7 - Iowa, Kansas, Missouri, Nebraska and nine Tribal Nations)
EPA Region 8(States served by EPA Region 8 - Colorado, Montana, North Dakota, South Dakota, Utah, Wyoming and 27 Tribal Nations)
|
How Communities in the Great Plains are Adapting 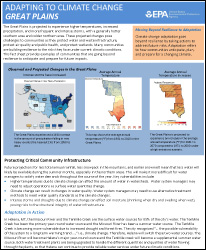
|
||||||||||||||||||||||||||||||||||||||||||||||||||||
| AZ |
The Southwest is projected to experience increased heat, drought, insect outbreaks, and wildfires. Declining water supplies, reduced agricultural yields, health impacts in cities due to heat, and flooding and erosion in coastal areas are additional concerns. Use the links below for additional information about:
|
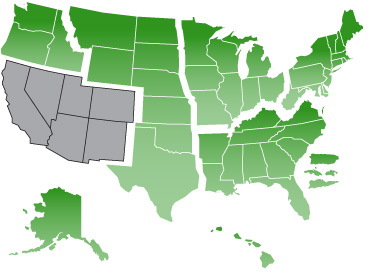
|
You selected the National Climate Assessment's Southwest Region. Below you can find an EPA regional climate adaptation contact, EPA Regional Climate Adaptation Implementation Plan (2014), and state climate adaptation website corresponding to your location. States and territories covered by EPA regions are provided to help you identify localized information. EPA Region 6(States served by EPA Region 6 - Arkansas, Louisiana, New Mexico, Oklahoma, Texas and 66 Tribal Nations)
EPA Region 8(States served by EPA Region 8 - Colorado, Montana, North Dakota, South Dakota, Utah, Wyoming and 27 Tribal Nations)
EPA Region 9(States served by EPA Region 9 - Arizona, California, Hawai'i, Nevada, Pacific Islands and 148 Tribal Nations)
|
How Communities in the Southwest are Adapting 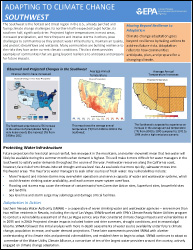
|
| group | image 1 | image 2 | image 3 |
|---|---|---|---|
| Air Quality |

|
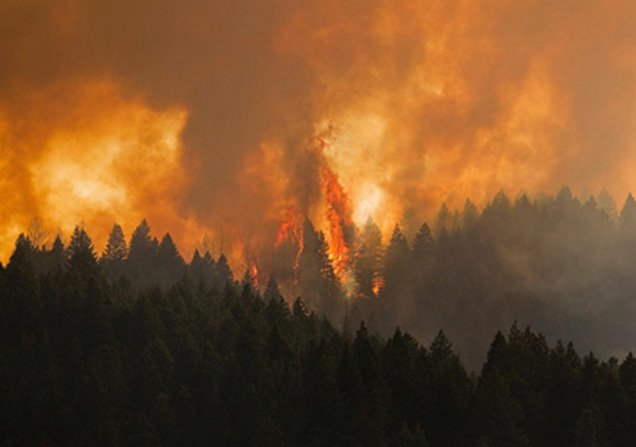
|
|
| Water Utility Facility Operations |
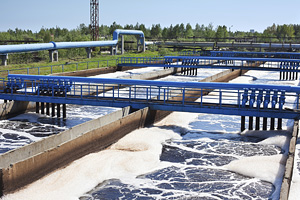
|
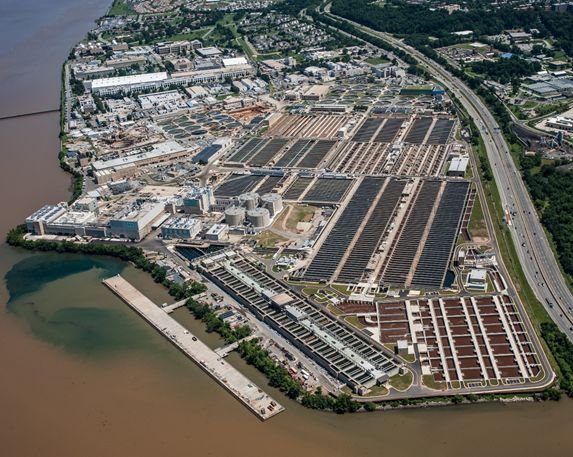
|
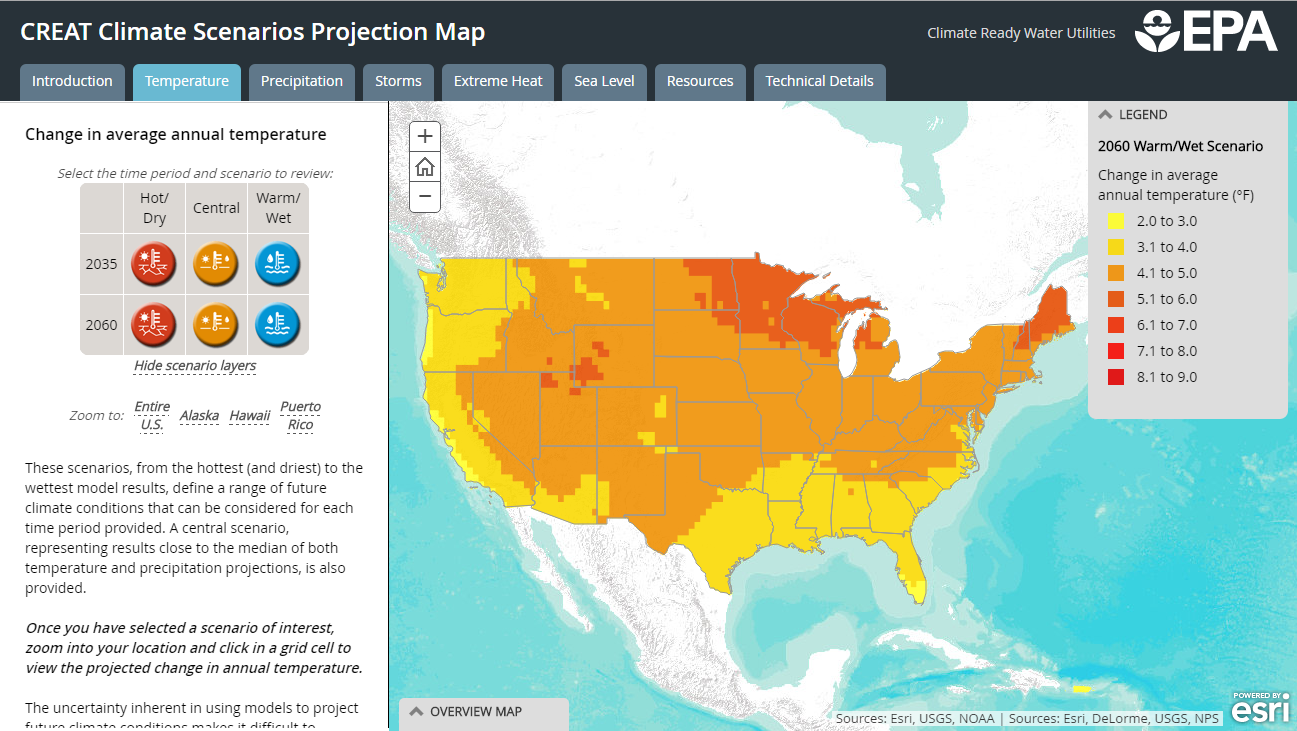
|
| Water Quality |
|
|
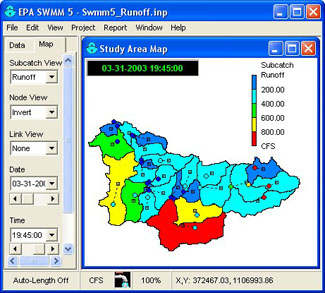
|
| Ecosystem Protection |
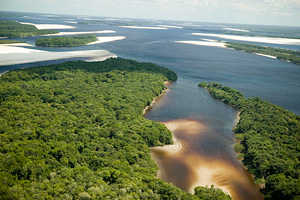
|
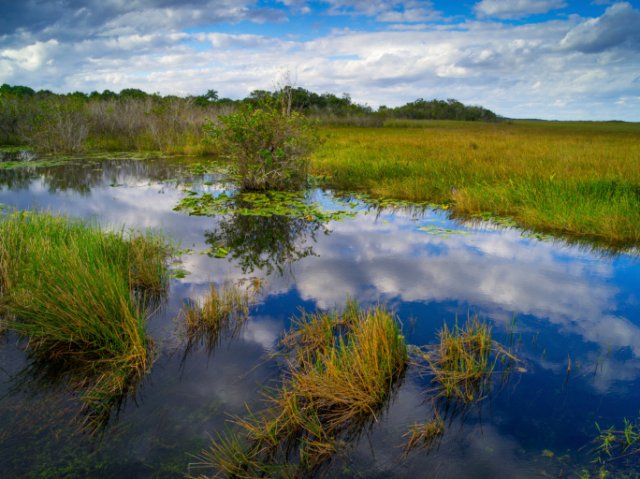
|

|
| Waste Management Emergency Response |
|
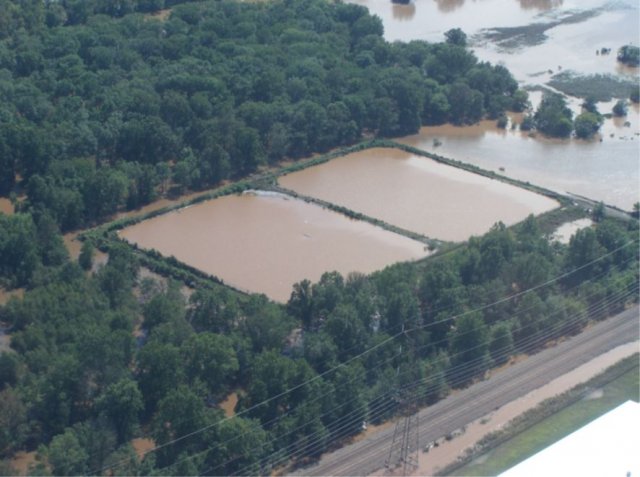
|
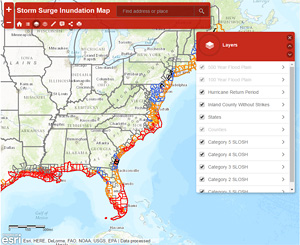
|
| Public Health |

|
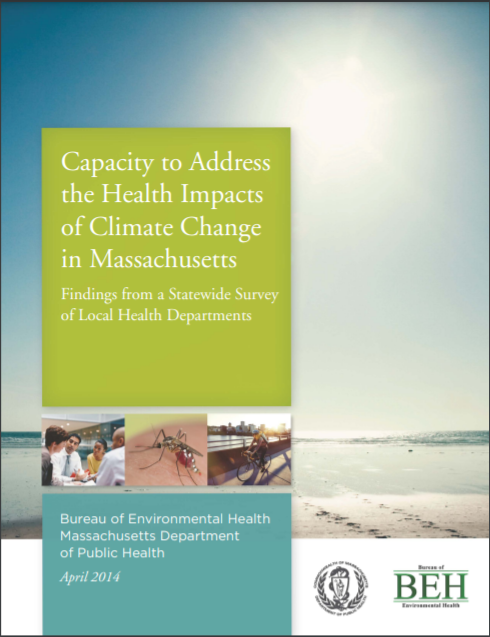
|
|
| Adaptation Planning |
|

|
|