U.S. flag

An official website of the United States government

Here’s how you know

Dot gov

Official websites use .gov
A .gov website belongs to an official government organization in the United States.

HTTPS

Secure .gov websites use HTTPS
A lock (LockA locked padlock) or https:// means you’ve safely connected to the .gov website. Share sensitive information only on official, secure websites.

    • Environmental Topics
    • Air
    • Bed Bugs
    • Cancer
    • Chemicals, Toxics, and Pesticide
    • Emergency Response
    • Environmental Information by Location
    • Health
    • Land, Waste, and Cleanup
    • Lead
    • Mold
    • Radon
    • Research
    • Science Topics
    • Water Topics
    • A-Z Topic Index
    • Laws & Regulations
    • By Business Sector
    • By Topic
    • Compliance
    • Enforcement
    • Laws and Executive Orders
    • Regulations
    • Report a Violation
    • Environmental Violations
    • Fraud, Waste or Abuse
    • About EPA
    • Our Mission and What We Do
    • Headquarters Offices
    • Regional Offices
    • Labs and Research Centers
    • Planning, Budget, and Results
    • Organization Chart
    • EPA History

Breadcrumb

  1. Home
  2. Great Lakes Monitoring

Integrated Atmospheric Deposition Network

Related Information
  • State of the Great Lakes 2022
  • Great Lakes Environmental Database (GLENDA)
  • Great Lakes Fish Monitoring and Surveillance Program

The Integrated Atmospheric Deposition Network (IADN) was established by the U.S. Environmental Protection Agency (EPA) in 1990 as part of a binational monitoring effort between the United States and Canada to monitor the atmospheric contributions of persistent toxic chemicals to the Great Lakes. Although levels of persistent toxic chemicals in the atmosphere are generally low, the large surface area of the Great Lakes provides an opportunity for significant atmospheric inputs of these chemicals. IADN collects quality-assured vapor, particulate, and precipitation measurements of several different classes of persistent toxic chemicals including polychlorinated biphenyls (PCBs), organochlorine pesticides, polycyclic aromatic hydrocarbons (PAHs), flame retardants, and per- and polyfluoroalkyl substances (PFAS).

Sampling Stations

 Atmospheric deposition samplers at the Sleeping Bear Dunes National Lakeshore IADN station.
Atmospheric deposition samplers at the Sleeping Bear Dunes National Lakeshore IADN station.
Map of the Great Lakes Integrated Atmospheric Deposition Network at Eagle Harbor, Chicago, Sleeping Bear Dunes, Cleveland, Sturgeon Point, Point Petre.
Map of IADN sampling stations.

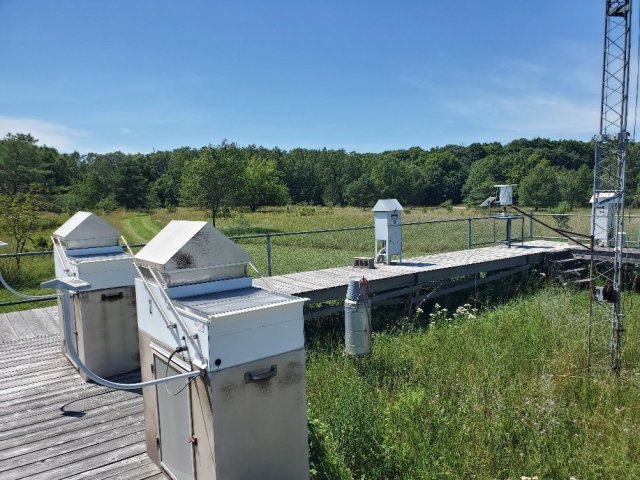
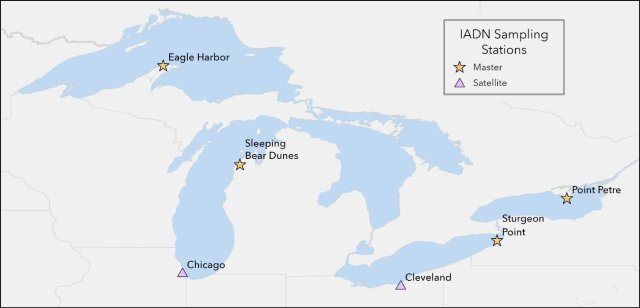
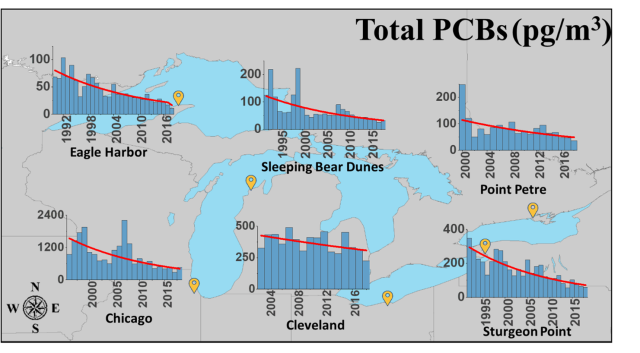
IADN has monitored persistent toxic chemicals in vapor, particulates, and precipitation at both urban and rural sites across the Great Lakes basin. Master stations are in rural areas on four of the Great Lakes (Eagle Harbor, MI; Sleeping Bear Dunes, MI; Sturgeon Point, NY; Point Petre, ON) to characterize the background basin-wide trends of persistent toxic chemical loadings to the lakes. Satellite stations are in two urban areas (Chicago, IL and Cleveland, OH) to better understand the contribution of large urban areas to persistent toxic chemical loadings to the Great Lakes. All stations are operated by EPA, except for Point Petre which is operated by Environment and Climate Change Canada.

Data and Trends

IADN data can be accessed via the Great Lakes Environmental Database (GLENDA). Overall, the atmospheric deposition of many chemicals monitored by IADN has declined over recent decades. In general, the concentrations of persistent toxic chemicals in atmospheric deposition are higher at urban stations than at rural stations. Read more about trends in atmospheric deposition of persistent toxic chemicals to the Great Lakes in the Toxic Chemicals in the Atmosphere Sub-Indicator Report in the 2022 State of the Great Lakes report.

Integrated Atmospheric Deposition Network Total PCB trends at Eagle Harbor, Chicago, Sleeping Bear Dunes, Cleveland, Sturgeon Point, Point Petre.
Annual median total polychlorinated biphenyls (PCBs) measured in the vapor phase at IADN stations (yellow markers) in the Great Lakes basin. The red line in each plot represents the calculated regression line, showing how PCB concentrations have changed over time. Note, the y-axis scales differ, as urban sites have higher concentrations than rural sites, and the years displayed for each plot depend on when the station was established.

Great Lakes Monitoring

  • Great Lakes Monitoring
    • Great Lakes Water Quality Monitoring Program
    • Integrated Atmospheric Deposition Network
    • Great Lakes Biology Monitoring Program
    • Great Lakes Fish Monitoring and Surveillance Program
  • EPA's Research Vessel Lake Guardian
  • Great Lakes Coastal Wetland Monitoring Program
    • Why Monitoring of the Great Lakes Coastal Wetlands is Important
    • How the Great Lakes Coastal Wetlands are Monitored
    • Where Great Lakes Coastal Wetlands Occur
    • Great Lakes CWMP Results and Major Findings
    • How the CWMP Data are Being Used
  • Cooperative Science and Monitoring Initiative (CSMI)
    • About Cooperative Science and Monitoring Initiative (CSMI)
    • 2021 Surveys Conducted on Lake Guardian
    • 2019 Surveys Conducted on Lake Guardian
Contact Us About Great Lakes Monitoring
Contact Us to ask a question, provide feedback, or report a problem.
Last updated on February 21, 2025
  • Assistance
  • Spanish
  • Arabic
  • Chinese (simplified)
  • Chinese (traditional)
  • French
  • Haitian Creole
  • Korean
  • Portuguese
  • Russian
  • Tagalog
  • Vietnamese
United States Environmental Protection Agency

Discover.

  • Accessibility Statement
  • Budget & Performance
  • Contracting
  • EPA www Web Snapshot
  • Grants
  • No FEAR Act Data
  • Plain Writing
  • Privacy
  • Privacy and Security Notice

Connect.

  • Data
  • Inspector General
  • Jobs
  • Newsroom
  • Regulations.gov
  • Subscribe
  • USA.gov
  • White House

Ask.

  • Contact EPA
  • EPA Disclaimers
  • Hotlines
  • FOIA Requests
  • Frequent Questions
  • Site Feedback

Follow.