
4. Using the Mapper Functions
4.1 Opening the Mapper
When you first open the Mapper tool from the RE-Powering landing page, you will see a box with an explanation of the Mapper and contact information for the RE-Powering America’s Land Initiative. Click “OK” to access the application.
The Mapper will be populated with orange dots representing the RE-Powering sites pre-screened for solar, wind, biopower and geothermal energy potential and purple triangles, representing completed renewable energy projects on contaminated lands. The active layers and their symbols will be visible in the Layer and Legend panel, which can be opened by selecting the Layer and Legend icon (9) at the bottom of the screen.
Note: The time it takes to load data into the web map roughly corresponds to internet speed, plus the number of layers you want to visualize and the scale at which you are looking at the map. Thus, it may take a few more seconds to load all data for the whole United States than to load one layer for a particular community.
4.2 Getting Around the Mapper
This section explains how to turn layers on and off, change the basemap, access the about information, zoom in an out of the map and go to the home page.
4.2.1 How to Access Information About the Mapper
If you are in the Mapper, click on the About icon (18). This tool will open a welcome screen that provides information about the RE-Powering Mapping application and links to resources like RE-Powering Team contact information and this User Guide.
4.2.2 Turning Data Layers on and Off
You can turn layers on or off at any time.
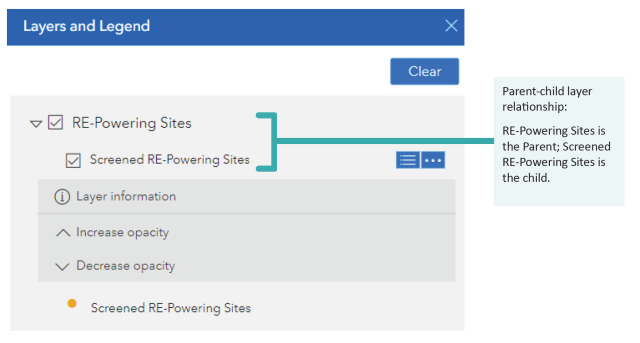
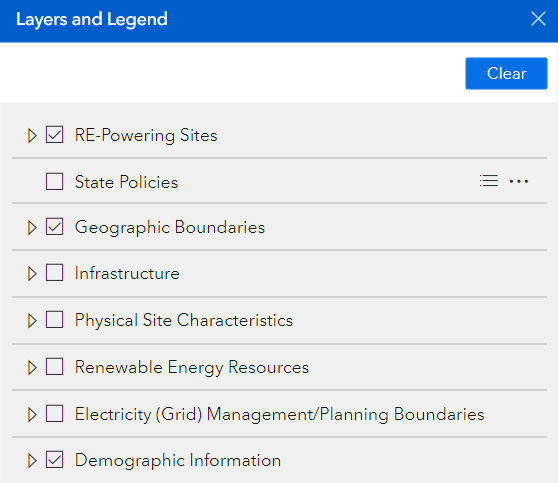
- If not already displayed, click the Layers and Legend icon (9) (see Figure 1)
- Expand layer groups by clicking the triangle next to the group name to turn on and off each layer you wish to view.
- To turn on layers, click the box next to the layer group name, which allows the layers in the group to be individually turned on and off. A check in the box indicates a layer is on; note: the parent layer must be on before the child layer is viewable on the map (see Figure 1 below).
- Click the checked box to turn the layer off and remove it from map view.
- Adjust opacity of each layer in the Layers and Legend tool by selecting "..." and using the up and down arrows to obtain the desired opacity. This can be useful when viewing multiple layers that overlap.
Note: Changing the opacity, or transparency, of a layer in a map allows you to see more, or less, of the underlying layers. In other words, it controls how much the layers below can show through. - Click Clear to reset the layer visibility to the original view.
4.2.3 Accessing the Attribute Table
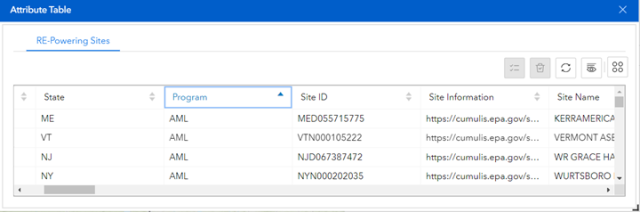
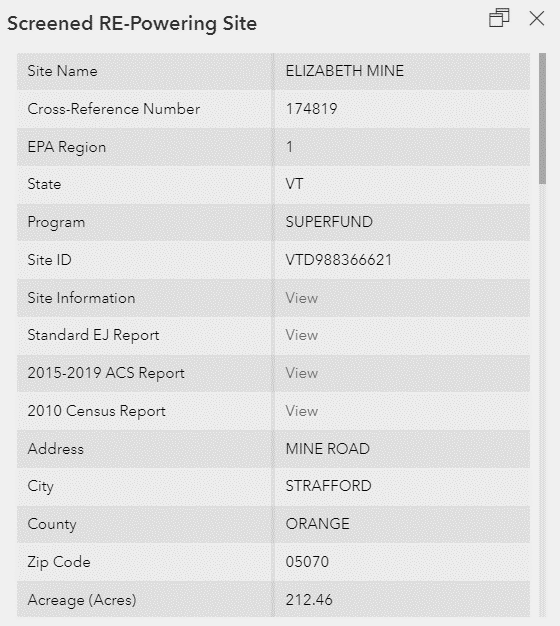
Users can open an attribute table for the Screened RE-Powering sites by clicking on the Attribute Table icon (11). This will open the attribute table, where users can scroll through site information for RE-Powering sites (see Figure 2). Users can also order RE-Powering sites by attribute by clicking the column header, show selected features, clear selected features, reset the attribute table, hide columns or export attribute table content (note: you are limited to exporting 5,000 records at a time).
4.2.4 Changing the Background
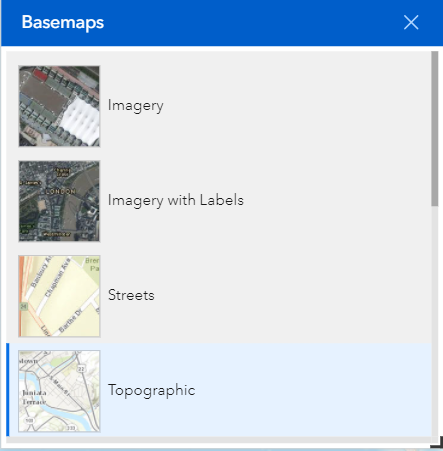
The default background for the Mapper is a topographic map, which may be useful to get a better sense of terrain or to see names of places. If you would prefer a simpler background, a street-based background or even aerial photography, there are several options available that you can select depending on your needs. To change the background, click on the Basemap icon (13). Choose from among the available options by clicking on the background type you wish to display (see Figure 3).
4.2.5 Zoom
To zoom in or out of the map use the Zoom tool (1) located in the upper left corner of the RE-Powering Mapping application. The "+" sign zooms the map in closer and the "-" zooms the map out.
4.2.6 Home
The Home icon (7) located in the upper left corner of the Mapper application resets the mapping application view back to original extent.
4.3 Selecting Sites
There are several ways to search for sites using the Filter, Predefined Queries, Search or Select Features tools. Each of these tools is described in the sections below.
4.3.1 Filter Tool
The Filter tool is in the toolbar at the bottom of the screen and is accessed by selecting the Filter icon (10). The filter dialogue box will open (see Figure 4). Expand the filter by selecting the triangle, populate the filter as described by the text and toggle the filter on and off by using the sliding button. If the filter does not appear to be working, double check that you have turned it on with the sliding button. Multiple filters can be applied at the same time to create a specific set of sites that meet multiple requirements. The selected filters dynamically alter the map display to show only those filtered sites. The “Number of Filtered Features” at the top right also changes to indicate the number of filtered sites. The sites displayed in the attribute table also dynamically change to reflect what was selected by the filters.

4.3.1.1 Clearing the Filters
Use the clear button, at the top right of the filter box, to clear the filters from the map. This feature only turns off the filters, it does not reset your selections. If you wish to reapply your previously selected filters, just click the sliding button to turn the filter back on again.
4.3.2 Predefined Queries Tool
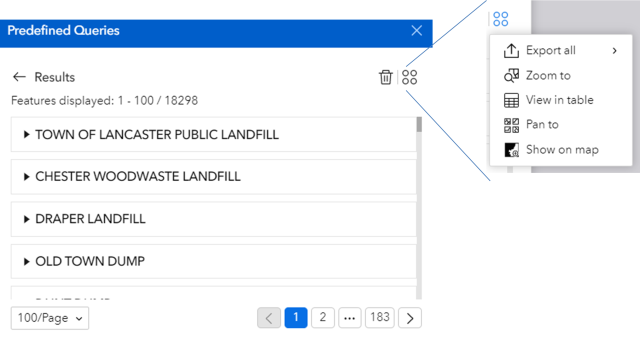
The Predefined Queries tool (16) is in the toolbar in the bottom center of the screen. Using this tool opens a list of predefined queries for some of the most common inquiries that RE-Powering has received. These lists can be a useful starting point for identifying and generating a list of potential sites. Click on the predefined query of interest (see Figure 5) to initialize the query.

A description of the query will appear (see Figure 6). To run a query, click “Apply”.
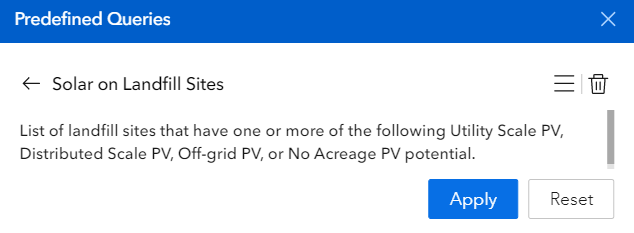
The list of sites will be displayed after running the query (see Exporting Data). Click the four dots in the right corner options to export the list (exporting is limited to 5,000 records), zoom, view in table, pan and show on map (sites will be highlighted in yellow) (See Figure 7).
4.3.3 Search Tool
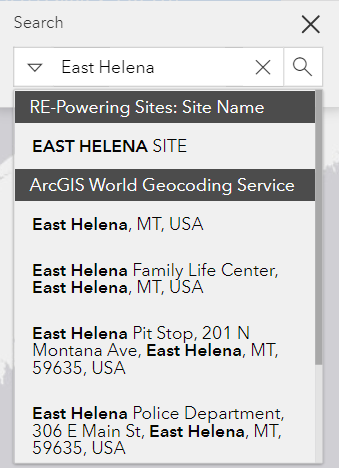
The Search tool allows a user to search for a specific geographic location (for example a street address or county) or specific site name included in the RE-Powering dataset. Select the magnifying glass (6) in the upper right corner of the application. As you start typing, options that match your query will appear in a drop-down menu. In Figure 8 below you can see both a RE-Powering site name and a location are provided as choices. You can continue populating the field or select the correct item you wish to explore. The map will automatically zoom to the location. This tool is useful if you are interested in a particular site or area, while the Filter and Predefined Query tool are useful for generating lists of specific sites.
4.3.4 Selection Tool
The Select Features tool (2) allows a user to select features on the map. After clicking the tool, some options appear (see Figure 9), click the downward triangle to open options for the tool. You can select features in a rectangle, polygon, circle or along a line or a point. You can view and/or export selected sites in the attribute table (see Figure 9).
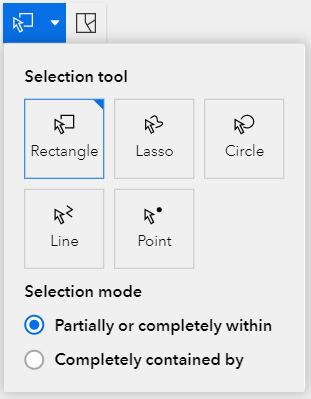
Use the Clear Features tool (3) to clear selections. Features will be selected from all layers that are active. Click the Select Features tool again to deactivate the tool (tool is blue when active, gray when not active).
4.3.5 Examples of How to Find Sites
Example question 1:
Where are the landfills that have been pre-screened positively for solar in Massachusetts?
- Click on the Filter icon (10).
- Select the state filter and select “MA.”
- Turn the filter on with sliding button.
- Click on the Predefined Queries icon.
- Apply the “Solar on Landfill Sites” query.
Sites that fit these criteria will now be displayed (if you followed the above steps there will be 547 features in the table). You may export, zoom to, view in table, pan to and show on map (sites will be highlighted in yellow).
Example question 2:
How many wind sites have a potential capacity of greater than 10 MW?
- Click the Filter icon (10) to open the filter tool.
- Turn on the Wind Potential filter by sliding the button.
- Expand the Estimated Wind Energy Capacity (MW) filter.
- Populate the Estimated Wind Energy Capacity is between boxes with 10 and 1600 (note: 1,600 is the maximum wind capacity value used for the RE-Powering sites).
Sites that fit these criteria will now be displayed on the map and in the attribute table (there will be 717 filtered features). You can export the table if you want.
4.4 Adding Data to the Mapper
In some instances, the user may wish to Add Data (17) layers to the Mapper. There are three ways to add data:
- Search ArcGIS Online Content – this allows you to search the ArcGIS online content for published data layers to add to your map.
- Feature Service Layer URL – if you know the URL for a feature service you wish to add you can type or paste the URL here.
- A zipped shapefile or a GEOJSON file – if you have your own geospatial data, you can add zipped shapefiles and GEOJSON files here.
Any data layers that are added to the RE-Powering Mapper will appear in the Layers and Legend and users can turn the layers on or off or adjust the opacity within this tool.
Figure 10 shows the add data screen for the ArcGIS online content, layers can be sorted several ways. Click “Add” to add the layer to the RE-Powering Mapper. To remove an added layer, select “Remove layers from the map.”

Figure 11 shows how to add data using an URL. Type or copy/paste the URL in the entry form and select "Add Layer" to add data. Press "Clear" to remove the layer from the Mapper.

Figure 12 shows how to add shapefiles or GEOJSON files. Shapefiles need to be zipped before they can be added. To add the files select "Choose File" and navigate to the file you wish to add, then select "Add Layer" to add data. Press "Clear" to remove the layer from the Mapper.

4.5 Printing and Exporting Data
Sometimes it may be useful to print a map or export data to share with others, include in a report or save for later. This can be especially useful if you do not have a GIS department or to share information or provide an example for your GIS department or others.
4.5.1 Printing Data
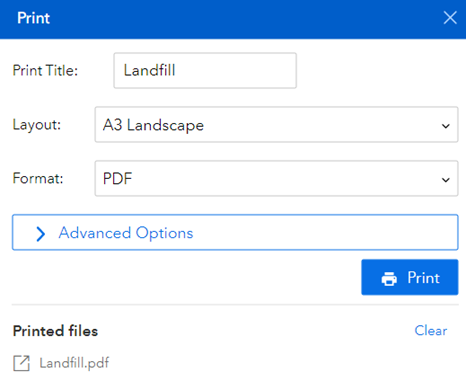
Images can be printed directly from the application. The print function will print the current view of the mapping application. Click on the Print icon (15) in the toolbar at the bottom center of the screen. This will open the print dialogue box (Figure 13). Here you will have some options to choose from:
- Layout is the size and view of the printout.
- Format lets you choose from many common formats (PDF, PNG, JPG, GIF and more) to better suit your needs.
- Advanced Options let you add an author and/or copyright if you choose.
- Once the file has finished printing, click on the hyperlink under “Printed files” (Landfill.pdf in Figure 13 below) to open the map.
Note: printing may take a few seconds depending on how many features are included and the extent of the zoom. While printing is in progress the name of the file under “Printed files” is disabled. When the printed file is complete, the filename will be enabled with the "export" button visible next to it.
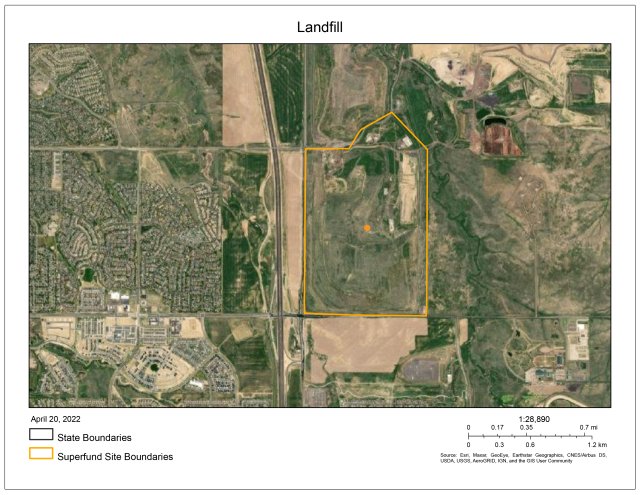
The printout includes a collar with a map title, legend, date and scale bar (See figure 14). Unless you chose to print “Map Only” and then no mapping collar or information is included.
4.5.2 Exporting Data
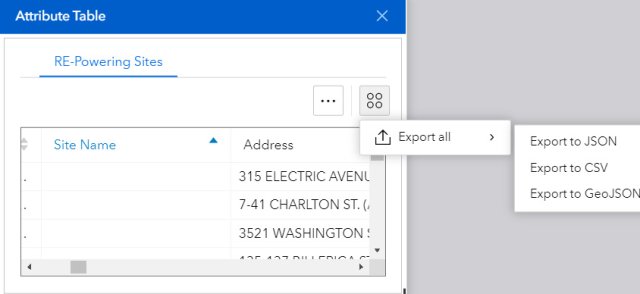
To export your lists from the above filters or any other specific search click in the Attribute Table icon (11). This will open the attribute table; click the four dots in the right corner to expand the options for exporting (see Figure 15). You are limited to exporting 5,000 records at a time. If you wish to obtain all the sites, you can download a Microsoft Excel file or a geodatabase containing all the RE-Powering sites from the page "How to Identify Sites".
4.6 Measuring Features
A user may know an area well and want to use knowledge of a site boundary to take a measurement of an area. Or a user may want to calculate the distance of a site to another feature on the landscape. The Measure tool (12) allows a user to do both.
Click Measure icon (12), in the toolbar at the bottom center of the screen. This will open the Measure tool (Figure 16).
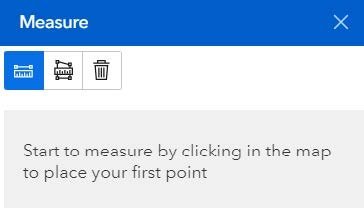
Click on the Polygon Measuring Tool to measure distance in a line. Click along the line to measure a distance. Double click on the last point to finish the measurement.
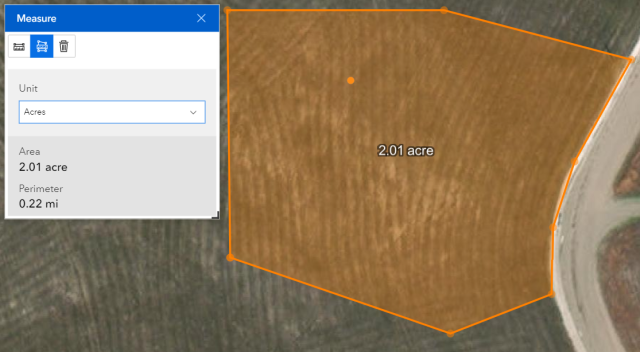
Click the Polygon Measuring Tool to measure a polygon area. Click at the vertices of your polygon to measure the area. Double click on the last point to finish the measurement. Use the drop down menu to change units (see Figure 17).
4.6.1 Example of Taking a Measurement
Example question:
What is the area of a landfill of interest?
- Open the Measure tool (12).
- Select the polygon measuring tool.
- Click on the vertices of the polygon.
- Double click to close the polygon.
- Use the drop-down menu to change the units to Acres.
4.7 Bookmarking
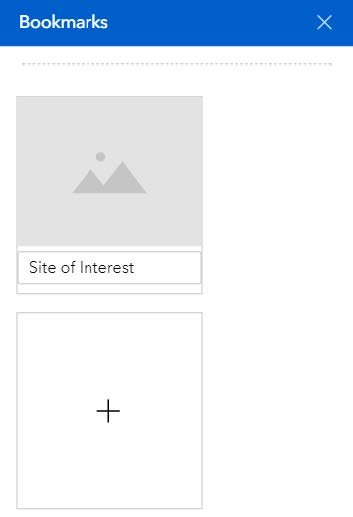
It may be necessary for a user to keep track of places that are meaningful or worth saving for future review. In this case, you can use the Bookmark tool (14) to create a custom bookmark to the desired location, layers and scale. These will be available any time you open the application. To add a Bookmark, zoom to the desired spot, type in the name and click the plus button (Figure 18).
4.8 Read Pop-up Box for Site Information Summary
You may wish to see a quick snapshot of a site of interest. Pop-up boxes have information about a site, drawn directly from the attribute table. The box appears when the user clicks on the site symbol in the map. In addition to pop-ups for the RE-Powering sites, they are also available for the other layers.
Sometimes there might be multiple entries made when you click on a site. This could be due to selecting multiple sites or multiple layers are turned on. You can click on a site and scroll through the pop-up boxes using the arrows at the bottom of the pop-up. The example in Figure 19 has five popups. The popups can also be docked in the mapping application for easier viewing.
Inside the Pop-Up box, you will see two links that provide more specific information about the site and might be useful in determining an appropriate reuse option for the site (Figure 20).
- Site Information links to EPA or state program responsible for managing the site and includes more information about the site clean-up progress and status.
- RE-Powering Profile links to a summary page describing the renewable energy screening results for that site.
4.9 Data Layers Included
The data layers presented below show RE-Powering specific information and supplemental information to help users better visualize site details and information that might be beneficial in determining renewable energy potential at these sites. Figure 21 shows the parent data layer categories. Below is a brief description of the layers provided, metadata can be accessed within the RE-Powering Mapper.
RE-Powering Layers
Re-Powering Sites
- Screened RE-Powering Sites - national set of contaminated lands, landfills and mine sites that have pre-screened favorably for solar (PV), wind, biomass and geothermal heat pump resource potential.
- Completed Renewable Energy Projects - this dataset reflects completed (currently operating) renewable energy installations on contaminated lands, landfills and mine sites. See RE-Powering America’s Land Tracking Matrix for more information on these sites.
Supplemental Layers
RACER
- RACER Trust - includes a selection of industrial properties that are ideally suited for large-scale solar project development and available for long-term lease at minimal up-front costs. See Racer Trust's Solar and Energy Storage Properties for more information.
Geographic Boundaries
- State Boundaries - shows the borders of a state.
- Counties - displays county boundaries.
- American Indian Reservations - represents locations of American Indian Reservation lands in the lower 48 states as well as Alaska. The areas include all Reservations associated with Federally recognized tribal entities.
- Superfund Site Boundaries - contains polygons depicting EPA Superfund Site boundaries.
- Superfund Operable Unit Boundaries - contains polygons depicting EPA Superfund Operable Unit boundaries.
- Superfund Institutional Control Boundaries - contains polygons depicting EPA Superfund Institutional Control boundaries.
- EPA Advance Program Areas - shows participants who agreed to take proactive steps toward improving air quality (i.e., areas participating with respect to ozone, PM, or both ozone and PM).
Policy
- State Policies - the economic viability of renewable energy projects is closely tied to the policy context of the jurisdiction in which the projects are sited. States have adopted numerous policies to support greater investment in renewable technologies. The RE-Powering Mapper includes a layer with common types of policies that support or can be conducive to renewable energy at the state level.
- 2024 Metropolitan Statistical Area (MSAs) or Non-MSAs that are Energy Communities
- 2024 MSAs/Non-MSAs that only meet the Fossil Fuel Employment Threshold
- 2024 Coal Closure Energy Communities
- 2024 MSAs/Non-MSAs that are Energy Communities
- 2024 MSAs/Non-MSAs that only meet the Fossil Fuel Employment Threshold
- 2023 Coal Closure Energy Communities
- 2023 MSAs/Non-MSAs that are Energy Communities
- 2023 MSAs/Non-MSAs that only meet the Fossil Fuel Employment Threshold
Infrastructure
- Electric Transmission Lines - represents electric power transmission lines.
- Power Plants - represents electric power plants.
- Transportation - consists of roads, railroads, trails, airports and other features associated with the transport of people or commerce.
Physical Site Characteristics
- Land Cover - provides nationwide data on land cover classes at a 30m resolution.
- Slope/Hillshade - provides a hill-shaded surface generated dynamically using the elevation layer with a solar azimuth of 315 degrees and solar altitude of 45 degrees.
Renewable Energy Resources
- Solar - provides annual average daily total solar resource averaged over surface cells of 0.038 degrees in both latitude and longitude, or nominally 4 km in size.
- Wind - multi-year (2007-2013) annual average wind speed, meters per second, at 80 meters above surface level.
- Biomass - contains information about the biomass resources generated by county in the United States. It includes the following feedstock categories: crop residues, forest residues, primary mill residues, secondary mill residues, and urban wood waste.
Electricity (Grid) Management/Planning Boundaries
- Electric Retail Service - represents electric power retail service territories. These are areas serviced by electric power utilities responsible for the retail sale of electric power to local customers, whether residential, industrial or commercial.
- NERC Regions - Represents North American Electric Reliability Corporation (NERC) regions. NERC is an international regulatory authority that works to improve the reliability of the bulk power system in North America.
- Control Areas (Balancing Authorities) - represents electric power control areas. Control Areas, also known as Balancing Authority Areas, are controlled by Balancing Authorities, who are responsible for monitoring and balancing the generation, load, and transmission of electric power within their region, often comprised of the retail service territories of numerous electric power utilities.• Independent System Operators - represents electric power Independent System Operators. Independent System Operators were set up by the Federal Energy Regulatory Commission (FERC) to provide non-discriminatory access to power and to more adequately administer the transmission grid on a regional basis throughout North America.
- Independent System Operators - represents electric power Independent System Operators. Independent System Operators were set up by the Federal Energy Regulatory Commission (FERC) to provide nondiscriminatory access to power and to more adequately administer the transmission grid on a regional basis throughout North America.