
5. Data Documentation for Mapping and Screening Criteria for Renewable Energy Generation Potential on EPA- And State-Tracked Sites
5.1 Overview
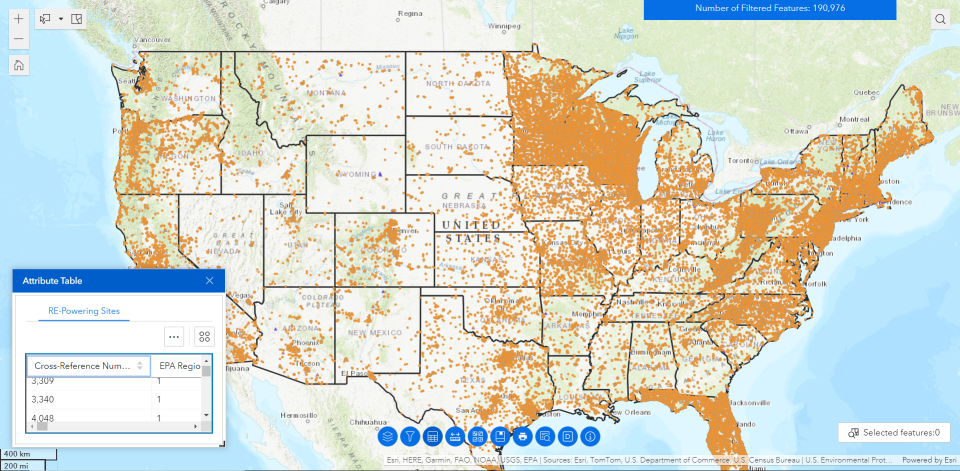
The U.S. Environmental Protection Agency created the RE-Powering America’s Land Initiative to demonstrate the enormous potential that contaminated lands, landfills and mine sites provide for developing renewable energy in the United States. To that end, the Initiative developed the RE-Powering Mapper tool. The tool is a publicly available spatial database of more than 190,000 sites that have been evaluated for renewable energy potential. This section details the screening process and data underlying the Mapper.
EPA developed national-level site screening criteria in partnership with the U.S. Department of Energy National Renewable Energy Laboratory. The most recent screening occurred in August 2021. Described in this document, the screening criteria demonstrate the potential to reuse contaminated land for solar, wind, biomass and geothermal energy production based on resource availability, acreage and distance to transmission lines and roads. Although these sites have been preliminarily screened for renewable energy potential based on several technical considerations, many other factors should be considered to determine a project’s ultimate feasibility. Renewable energy developers and/or relevant stakeholders usually conduct rigorous site-specific analyses to verify both technical and economic feasibility.
For the purposes of this screening, the Mapper does not consider site status in terms of clean-up or potential contamination status. Sites may or may not have been assessed and/or remediated. The Mapper database includes a link for each site to a source with more information about the site’s environmental conditions.
The federal- and state-tracked sites included in this screening represent a subset of nationwide contaminated lands, landfills and mine sites. The inventory includes sites that are tracked at the national level through EPA remediation and grant programs, as well as datasets provided from 22 state partners. Many additional sites are tracked at the state and local level but EPA did not screen them in the Mapper. Information regarding state brownfields and response programs can be found on the State and Tribal Response Program page.

5.2 Data, Criteria and Methodology
EPA developed an inventory of contaminated lands, landfills and mine sites from various sources, as listed here. Next, EPA screened this subset of EPA- and state-tracked sites for renewable energy resource potential, as described in the Screening Criteria.
5.2.1 Site Information Datasets
While EPA and state databases are refreshed regularly with new sites and updated acreage, the data in the Mapper represent a snapshot in time. The tables in this section provide sources and timing of data extraction and screening. Users should understand that the site-specific information provided herein may change over time.
EPA does not maintain or manage state datasets. Snapshots of the following states’ data are included in this update of the Mapper: California, Colorado, Connecticut, Florida, Hawai’i, Illinois, Iowa, Maine, Maryland, Massachusetts, Minnesota, Missouri, New Jersey, New York, North Carolina, Oregon, Pennsylvania, Rhode Island, Texas, Virginia, West Virginia, and Wisconsin.
5.2.2 EPA Datasets
| Program Name | Description of Dataset Used in Analyses | Data Accessed | Date of Screening |
|---|---|---|---|
| Abandoned Mine Lands | AML sites include abandoned hardrock mines and mineral processing sites listed in the Superfund Enterprise Management System at this time. Includes AML sites on the National Priorities List, often referred to as "Superfund" Sites, and abandoned mine sites where EPA has conducted response actions under Superfund Removal Authorities. Visit the website for more information. | 5/2021 | 8/2021 |
| Brownfields | Brownfields are real property where expansion, redevelopment or reuse may be complicated by the presence or potential presence of a hazardous substance, pollutant or contaminant. Brownfields are often found in and around economically depressed neighborhoods. Includes data in the Assessment Cleanup and Redevelopment Exchange System (ACRES) database. Data include information on properties associated with EPA Brownfields grants awarded in fiscal year 2010 and beyond, where an assessment or cleanup activity has been completed and EPA Brownfields funding was expended. Visit EPA’s Brownfields website for more information. | 3/2021 | 8/2021 |
| Landfill Methane Outreach | LMOP is a voluntary assistance and partnership program that promotes the use of landfill gas as a renewable, green energy resource. LMOP screens landfills to determine their landfill gas potential. In addition, LMOP tracks landfills that have operational, under construction or shutdown landfill gas energy projects. Visit the website for more information and definitions of landfill gas energy projects. | 6/2021 | 8/2021 |
| Resource Conservation and Recovery Act – Corrective Action | RCRA sites are commercial, industrial and federal facilities that treat, store or dispose of hazardous wastes and that require cleanup under the RCRA Hazardous Waste Corrective Action Program. Includes all facilities from the RCRA Corrective Action Progress Track. Visit EPA’s RCRA website for more information. | 5/2021 | 8/2021 |
| Superfund | Superfund sites are inactive or abandoned contaminated facilities or locations where there is a release or threatened release, into the environment, of hazardous substances, contaminants or pollutants being dumped, discharged, emitted or otherwise improperly maintained or managed. These sites may include manufacturing and industrial facilities, processing plants, landfills and mining sites, among others. The Comprehensive Environmental Response, Compensation and Liability Act authorizes cleanup response actions at these sites. The data for these sites were extracted from the SEMS. This dataset includes sites listed on, proposed to and deleted from the NPL, as well as some Superfund Alternative Approach sites. Visit EPA’s Superfund website for more information. | 4/2021 | 8/2021 |
| Underground Storage Tanks | As of August 2021, there are over 63,000 open Leaking Underground Storage Tank (LUST) sites that have not reached cleanup completed and almost 500,000 LUST sites that have a status of cleanup complete. It is important to note that the 50 LUST sites being piloted in the RE-Powering Mapper are a very small subset of the entire LUST universe. These 50 LUST sites are considered active releases located at inactive facilities. Many more LUST sites have the potential for redevelopment. On average these sites are typically around 0.5 acres and are located along highways and major roadways in cities and towns. Given their size and location, inactive facilities, along with open gas stations with active releases, may be good candidates for electric vehicle charging stations. The national universe of UST and LUST sites can be found in EPA’s UST Finder. | 8/2021 | 8/2021 |
5.2.3 State Agencies
The following table contains contact information for state agencies that provided information and data for the state-tracked sites included in the RE-Powering Mapper.
| State | Contact Information |
|---|---|
| California | California Department of Toxic Substances Control EnviroStor 1001 I Street P.O. Box 806 Sacramento, CA 95812-0806 877-786-9427 Email: envirostor@dtsc.ca.gov |
| Colorado | Colorado Department of Public Health and Environment 4300 Cherry Creek Drive South Denver, CO 80246 303-692-2000 Email: cdphe.information@state.co.us |
| Connecticut | Connecticut Department of Energy and Environmental Protection |
| Florida | Florida Department of Environmental Protection
|
| Hawaii | Hawai’i State Department of Health Hazard Evaluation and Emergency Response Office 2385 Waimano Home Road #100 Pearl City, HI 96782 Telephone: 808-586-4249 |
| Illinois | Illinois Environmental Protection Agency
|
| Iowa | Natural Resources Department Wallace State Office Building 502 E 9th St 4th Floor Des Moines, IA 50319-0034 515-725-8200 |
| Maine | Maine Department of Environmental Protection 17 State House Station 28 Tyson Drive Augusta, Maine 04333-0017 207-287-7688 |
| Maryland | Maryland Land Restoration Program 1800 Washington Boulevard Baltimore, MD 21230 410-537-3493 Email: mde.webmaster@maryland.gov |
| Massachusetts | Clean Energy Results Program 100 Cambridge Street, Suite 1020 Boston, MA 02114 617-626-1000 Email: BWSC.Information@state.ma.us |
| Minnesota | Minnesota Pollution Control Agency 520 Lafayette Road N. St. Paul, MN 55155-4194 800-657-3864 Email: info.pca@state.mn.us |
| Missouri | Missouri Land Reclamation Program P.O. Box 176 Jefferson City, MO 65102-0176 573-751-4041 Email: mining@dnr.mo.gov |
| New Jersey | Bureau of Climate Change & Clean Energy Division of Climate, Clean Energy and Radiation Protection Air Quality, Energy and Sustainability Program New Jersey Department of Environmental Protection 401 East State Street 2nd Floor East Wing Mail Code 401-02H PO Box 420 Trenton, NJ 08625-420 609-633-0538 Email: solar_siting_analysis@dep.nj.gov |
| New York | New York Department of Environmental Conservation Environmental Remediation 625 Broadway Albany, NY 12233-7012 518-402-9764 Email: derweb@gw.dec.state.ny.us |
| North Carolina | North Carolina Department of Environmental Quality |
| Oregon | Oregon Department of Environmental Quality Environmental Cleanup Program 700 NE Multnomah St., Suite 600 Portland, OR Email: DEQInfo@deq.state.or.us |
| Pennsylvania | Bureau of Abandoned Mine Reclamation Rachel Carson State Office Building P.O. Box 69205 Harrisburg, PA 17106-9205 717-783-2267 Email: RA-epcontactus@pa.gov |
| Rhode Island | Rhode Island Department of Environmental Management Office of Land Revitalization and Sustainable Materials Management Site Remediation Program 235 Promenade Street Providence, RI 02908-5767 401-222-2797 |
| Texas |
|
| Virginia |
|
| West Virginia | Office of Abandoned Mine Lands and Reclamation 601 57th Street, SE Charleston, WV 25304 304-926-0499 Contact form |
| Wisconsin | Wisconsin Department of Natural Resources Remediation and Redevelopment Program 101 S. Webster Madison, WI 53707 |
5.2.4 State-Tracked Abandoned Mine Lands Datasets
EPA included two types of AMLs in this analysis. The first are coal mining sites that were operated prior to August 3, 1977. The federal Surface Mining Control and Reclamation Act of 1977 created a fund to eliminate (reclaim) health and safety hazards associated with coal mining operations that were abandoned before the statute was enacted. As a result of the act, Pennsylvania, Virginia and West Virginia developed these datasets as inventories of AML sites eligible for reclamation. The second type of AMLs in the Mapper includes hard rock and other mineral mine sites.
| State AML Dataset | Description of Dataset Used in Analyses | Data Accessed | Date of Screening |
|---|---|---|---|
| Missouri AML | Depicts boundaries of AML projects in Missouri. This data set contains polygons that represent the construction boundary for past AML reclamation projects. This is not an exhaustive list. | 3/2021 | 8/2021 |
| Missouri Industrial Minerals | Contains industrial (limestone, barite, sand, gravel, clay and others) mineral sites that have or have had permits. | 3/2021 | 8/2021 |
| Missouri Metallic Minerals | Contains metallic (lead, zinc, iron, gold and others) mineral sites that have or have had permits. | 3/2021 | 8/2021 |
| New Jersey Geological and Water Survey – AML | A polygon shapefile that contains AMLs in New Jersey | 4/2021 | 8/2021 |
| New Jersey Geological and Water Survey - Sand and Gravel Operations | A polygon shapefile that contains registered and non-registered sand and gravel operations in New Jersey. Only nonregistered sand and gravel operations were evaluated in this study. | 4/2021 | 8/2021 |
| Pennsylvania Abandoned Coal Mine Lands | Portrays the approximate location of AMLs Problem Areas containing public health, safety and environmental problems created by past coal mining that occurred prior to SMCRA enactment. The data represent the AML inventory sites, which are the boundary of an entire problem area and may contain multiple actual mining features. The dataset does not include ownership or parcel information. Most sites are owned privately. When needed, ownership information must be researched through other means, typically county real estate records. | 4/2021 | 8/2021 |
| Virginia Abandoned Coal Mine Areas | A polygon shapefile obtained from the Virginia Department of Mines, Minerals and Energy’s Division of Mined Land Reclamation. The dataset represents polygons of lands impacted by coal mining. This dataset is derived from several sources, including USGS topographic quadrangles, coal mine permit applications and mine map collections. These datasets were created with various methods and at different scales and resolutions and will vary in accuracy. Some of these areas may represent sites that have been re-mined. | 4/2021 | 8/2021 |
| Virginia Orphan Land Program | Represents orphaned mineral mining sites in Virginia operated prior to 1968, when the Virginia Reclamation Law was enacted. Once identified, an orphaned mine site is evaluated for its potential hazards to the environment and the public’s health and safety. This may include soil and water investigations, studies on the feasibility of reclaiming the site, cost analysis, and seeking landowner consent to allow reclamation to proceed. This data comes from the Virginia Department of Mines, Minerals and Energy’s Division of Mineral Mining. | 5/2018 | 8/2021 |
| West Virginia Abandoned Coal Mine Areas | Represents AML problem areas comprising various types (portals, highwalls, piles or embankments, etc.). These are identified by PAD Name and Number (WV-****). Each PAD can contain one feature, or multiple features of one or more problem type. Data comes from the West Virginia Office of Abandoned Mine Lands and Reclamation. | 3/2021 | 8/2021 |
5.2.5 State-Tracked Contaminated Site Datasets
Most states track and remediate contaminated sites; the level of detail and types of information tracked and reported varies from state to state. EPA aims to standardize the reported data gathered in this study to capture the most important information consistently across a wide range of states. In addition, EPA eliminated duplicates between state and federal datasets (to the extent possible) and verified locations. These data represent a snapshot in time.
| Name Dataset | Description of Dataset Used in Analyses | Data Downloaded | Date of Screening |
|---|---|---|---|
| California Department of Toxic Substances Control | Populates the EnviroStor database system with information about sites that are known to be contaminated with hazardous substances as well as information on uncharacterized properties where further studies may reveal problems. The dataset was downloaded from. | 7/2021 | 8/2021 |
| Colorado Brownfield | Includes sites in the Colorado Brownfields Program, which provides public and private property owners with resources to facilitate cleanups at abandoned industrial facilities, long-forgotten gas stations and other potentially contaminated properties that would otherwise languish and hinder economic development. | 7/2021 | 8/2021 |
| Colorado Institutional Control | Includes sites classified under State of Colorado SB 145 and SB 037 (collectively referred to hereafter as “SB 145”) create three different mechanisms for implementing Institutional Controls imposed as part of remediation decisions. But the statute does more than simply create these legal mechanisms. It also requires controls be implemented in specific situations, and establishes procedures for ensuring that the people who need to know about the restrictions do, in fact, know of them. The statute specifies certain terms that must be included in all covenants and restrictive notices. It also creates procedures for modifying and terminating covenants and restrictive notices. | 7/2021 | 8/2021 |
| Colorado Municipal Landfills | Includes municipal landfills open for public access within the State of Colorado. | 7/2021 | 8/2021 |
| Colorado Uranium Mill Tailings Radiation Control Act | Contains sites classified under the Uranium Mill Tailings Radiation Control Act of 1978. The Act gave the Department of Energy the responsibility of stabilizing, disposing and controlling uranium mill tailings and other contaminated material at 24 uranium mill processing sites located across 10 states and at approximately 5,200 associated properties. In the 1950s and 1960s, private firms processed most uranium ore mined in the United States. After uranium mining came under federal control, companies abandoned their mill operations, leaving behind materials with potential long-term health hazards. These mills contained low-level radioactive wastes and other hazardous substances that eventually migrated to surrounding soil, groundwater and surface water, and also emitted radon gas. | 7/2021 | 8/2021 |
| Colorado Voluntary Cleanup and Redevelopment Program | Contains sites listed under Colorado’s Voluntary Cleanup and Redevelopment Program, which was created in 1994 to facilitate the redevelopment and transfer of contaminated properties. | 7/2021 | 8/2021 |
| Connecticut Department of Energy & Environmental Protection | Includes sites in Connecticut that have received a brownfields grant or loan from EPA or the state, or that have enrolled in one of the state’s liability relief programs. | 5/2018 | 8/2021 |
| Connecticut Closed Landfills | Includes closed landfills in Connecticut. | 5/2018 | 8/2021 |
| Florida Solid Waste Management | Contains facility-specific information on solid waste management facilities statewide. | 3/2021 | 8/2021 |
| Florida Brownfield | Brownfields are defined by the Florida Department of Environmental Protection as abandoned, idled or underused industrial and commercial facilities where expansion or redevelopment is complicated by real or perceived environmental contamination. | 3/2021 | 8/2021 |
| Florida Waste Cleanup Program | Contains information associated with waste cleanup sites at all stages of cleanup until final site rehabilitation completion is approved. Program areas include the Waste Site Cleanup Section, Site Investigation Section, Federal Programs Section, CERCLA Site Screening and Brownfields Redevelopment. | 3/2021 | 8/2021 |
| Florida Institutional Control Registry | Contains institutional control sites or sites that have certain restrictions on the property. For example, a site may be cleaned up to satisfy commercial contamination target levels. An institutional control may be placed on that property indicating that it may only be used for commercial levels. If the owner of the property ever wants to use that property for residential purposes, the owner will have to ensure that the contamination meets residential target levels. | 3/2021 | 8/2021 |
| Hawai'i Hazard Evaluation and Emergency Response Office | Inventory of brownfield sites from the Hawai’i State Department of Health - Hazard Evaluation and Emergency Response Office see real-time (use keyword “Brownfields" in the Viewer "Sites" Panel, left hand side). | 5/2021 | 8/2021 |
| Illinois Office of Site Evaluations Assessment | The Office of Site Evaluations Redevelopment Assessment database identifies the status of all properties within the state in which the Illinois EPA's Office of Site Evaluation has conducted a municipal Brownfield Redevelopment Assessment. | 4/2021 | 8/2021 |
| Illinois Site Remediation Program | These sites are part of the Illinois Site Remediation Program, which identifies voluntary remediation projects administered through the Pre-Notice Site Cleanup Program (1989 to 1995) and now the Site Remediation Program (1996 to the present). The program provides Remediation Applicants (i.e., any persons seeking to perform investigative or remedial activities) the opportunity to receive Illinois EPA review, technical assistance and no further remediation determinations from the Illinois EPA. This program is designed to be flexible and responsive to the needs of the Remediation Applicants. The goals and scope of actions at these sites are normally defined by the Remediation Applicants. See the Site Remediation Program Database for more information. | 4/2021 | 8/2021 |
| Iowa Land Recycling Program | The database has site information primarily from two state programs, Chapter 133 and Chapter 137 (also known as the Land Recycling Program).Chapter 133 and the Land Recycling Program are administered to address sites that are contaminated by hazardous materials or wastes. These programs focus on assessing the severity of such problems and on identifying and carrying out the appropriate remedial measures to assure the protection of public health and environment. In addition, the Land Recycling Program provides for limited liability protection from further regulatory action relative to the problem(s) addressed. Sites come to the attention of Iowa in various ways; however, the largest group consists of properties that have been the subject of environmental assessments, generally associated with real estate transfers. | 7/2021 | 8/2021 |
| Maine Remediation Sites | This data contains the locations of past and current sites located in Maine that are in the Voluntary Response Action Program, the Brownfields Program, the Landfill Closure Program, the Federal Facilities Program, the Superfund Program and/or the Uncontrolled Sites Program. The data includes location coordinates and status, and if the property has institutional controls. | 5/2021 | 8/2021 |
| Maryland Land Restoration Program | Consists of digital data describing sites under the oversight of Maryland's Land Restoration Program. Within the Land Restoration Program, three programs exist to investigate eligible properties with known or perceived controlled hazardous substance contamination, protect public health and the environment, accelerate cleanup of properties and provide liability releases and finality to site cleanup: the Voluntary Cleanup Program, the Brownfields Initiative and State Remediation Sites. | 4/2021 | 8/2021 |
| Massachusetts Land Disposal of Solid Waste | The Solid Waste Land Disposal data layer, which was compiled by the Department of Environmental Protection (MassDEP) to track the locations of land disposal of solid waste. Land disposal refers to an operation established in accordance with a valid site assignment for the disposal of solid waste into or on land (Landfill), or a location for disposal of solid waste from one or more sources that is not established or maintained pursuant to a valid site assignment or permit (Dumping Ground). | 4/2021 | 8/2021 |
| Massachusetts Contaminated Land Profiles | Contains sites in the Massachusetts Contaminated Land Profile List, which was compiled by MassDEP to identify sites that have had a release of oil or hazardous materials and are regulated under MGL c. 21E and 310 CMR 40.0000. This list includes a small subset of sites having characteristics favorable for renewable energy redevelopment, including historical and/or current industrial/commercial use; proximity to existing infrastructure (transmission lines, substations, roads, water and rail); potential local zoning/permitting designations compatible with reuse; and revitalization of distressed property versus degradation of open space. NOTE: Although many sites on this list may be considered brownfields under the Solar Massachusetts Renewable Target regulations at 225 CMR 20.00 (DOER Regulations) issued by the Massachusetts Department of Energy Resources, a site’s inclusion on this list DOES NOT AUTOMATICALLY QUALIFY IT as a brownfield under such regulations. Similarly, other sites not included on this list may qualify as a brownfield under the DOER Regulations. See the DOER Regulations and applicable DOER guidance for more information on which sites will be eligible for consideration as a brownfield. | 6/2021 | 8/2021 |
| Minnesota Pollution Control Agency Contaminated | A list of properties within the state that are contaminated. | 3/2021 | 8/2021 |
| New Jersey Site Remediation - Known Contaminated Sites | Known Contaminated Sites Known Contaminated Sites List for New Jersey (Non-Homeowner), which contains those non-homeowner sites and properties within the state where contamination of soil or groundwater has been confirmed at levels equal to or greater than applicable standards. This list of Known Contaminated Sites may include sites where remediation is either currently under way, required but not yet initiated or has been completed. See this webpage for more details. | 4/2021 | 8/2021 |
| New Jersey Solid & Hazardous Waste | A polygon shapefile of landfill parcel or parcels greater than 35 acres located in New Jersey. | 4/2021 | 8/2021 |
| New York Environmental Remediation Sites | A polygon shapefile containing records of the sites that have been remediated or are being managed under one of Division of Environmental Remediation’s remedial programs (i.e., State Superfund, Brownfield Cleanup, etc.). All sites listed on the "Registry of Inactive Hazardous Waste Disposal Sites in New York State (Registry)" are included in this database. The link for “More Info” will take the user to the NYSDEC online database, which provides all Registry information and access to site-related documents, including institutional controls and site management plans. | 3/2021 | 8/2021 |
| North Carolina Brownfield Projects | This dataset shows boundaries of Brownfields Projects that have entered into the program to receive a Brownfields Agreement. The boundaries and areas shown reflect the current status of the project in its progression towards having a recorded Notice of Brownfields Property with a finalized Brownfields Agreement. | 5/2021 | 8/2021 |
| North Carolina Hazardous Waste Sites | This dataset represents the location of sites within North Carolina that are regulated by the hazardous waste portions of the Resource Conservation and Recovery Act. This includes Large Quantity Generators, Small Quantity Generators, Transporters of Hazardous Waste, permitted treatment, storage or disposal (TSD) facilities and TSD facilities that are under an Order or a Consent Agreement. (Note: facilities that are Conditionally Exempt Small Quantity Generators may also be included if they are also a Transporter or TSD facility.) The data is extracted from the EPA RCRAInfo database. The State of North Carolina, Division of Waste Management, Hazardous Waste Section is the implementer of record for this data. The Hazardous Waste Section is authorized by EPA to administer the hazardous waste program. This dataset is intended for general planning and mapping purposes (rather than highly accurate analytical or public health purposes). | 5/2021 | 8/2021 |
| North Carolina Permitted Solid Waste Landfills | This dataset reflects all active and closed, but permitted Municipal Solid Waste, Construction and Demolition, Land-Clearing and Inert Debris and Demolition (Older facilities) landfill facilities. For all other Solid Waste facilities, please see the "Other Permitted Solid Waste Facilities" layer. The purpose of this map is to provide the public and other government entities a visual overview of facilities that undergo inspections and groundwater monitoring as part of facility management. | 5/2021 | 8/2021 |
| North Carolina Pre-regulatory Landfills | Includes pre-regulatory landfills. The Inactive Hazardous Sites Branch has a separate program for addressing pre-regulatory non-industrial landfills that ceased accepting waste before 1983. The Branch conducts the assessment and remediation of these sites directly. Local governments may conduct the assessment work and seek reimbursement of expenses if the work was pre-approved by the Branch. The Inactive Hazardous Sites Branch is located in the Superfund Section of the Division of Waste Management. | 5/2021 | 8/2021 |
| Oregon Environmental Cleanup Sites | Oregon Department of Environmental Quality Environmental Cleanup Site Information database. DEQ maintains the database to track cleanup sites in the state with known or potential contamination from hazardous substances, and to document sites where the Oregon Department of Environmental Quality has determined that no further action is required. Data in ECSI is "working information" used by the Environmental Cleanup Section. | 7/2021 | 8/2021 |
| Rhode Island DEM’s Office of Land Revitalization & Sustainable Materials Management Sites | This program also supports the redevelopment and reuse of contaminated Brownfield sites through the Brownfields program. Sites are identified, evaluated, cleaned up and brought back to beneficial reuse in Rhode Island communities. | 7/2021 | 8/2021 |
| Texas Municipal Solid Waste Facilities | A spreadsheet listing issued permits and other authorizations as well as pending applications for landfills and processing facilities that are active, inactive, or not yet constructed. Also lists issued and revoked permits and other authorizations for landfills and processing facilities that have closed, and applications that were withdrawn or denied. | 4/2021 | 8/2021 |
| Texas Superfund Sites | Sites in the state of Texas that have been designated as Superfund cleanup sites; includes both federal- and state-designated sites. Federal sites were excluded for the purpose of this analysis so as not to double count those already included in the EPA Superfund dataset. | 3/2021 | 8/2021 |
| Texas Voluntary Cleanup Program | Contains sites under the Texas Commission on Environmental Quality VCP, which provides administrative, technical and legal incentives to encourage the cleanup of contaminated sites in Texas. All non-responsible parties, including future lenders and landowners, receive protection from liability to the State of Texas for cleanup of sites under the program, eliminating most of the constraints for completing real estate transactions at those sites. As a result, many unused or underused properties may be restored to economically productive or community beneficial use. | 4/2021 | 8/2021 |
| Wisconsin Department of Natural Resources Waste Materials Management Program | Polygon representation of approximate extent of solid waste landfills and known historic waste sites. This dataset includes active and inactive solid waste landfills and known historic waste site points. | 7/2021 | 8/2021 |
| Wisconsin Department of Natural Resources Remediation Sites | Includes open and closed environmental remediation sites. Includes Environmental Repair Program and Leaking Underground Storage Tank (LUST) sites where contamination affected soil, groundwater or other media. Closed sites are when the department has determined, based on information available at the time, that no further remedial action is required and open sites require additional action. A "site" is a contamination incident, not a property. | 7/2021 | 8/2021 |
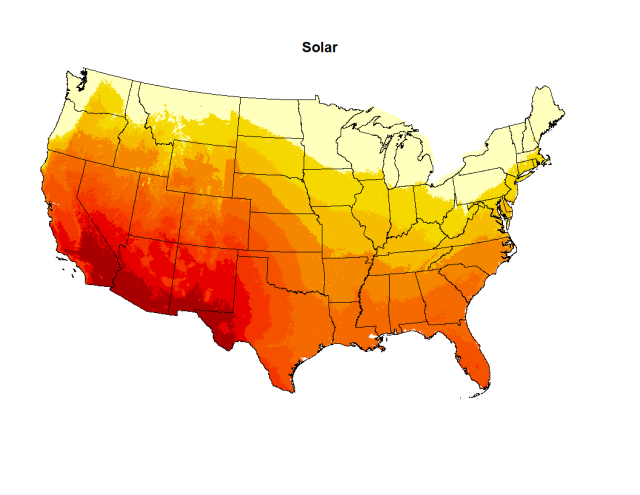
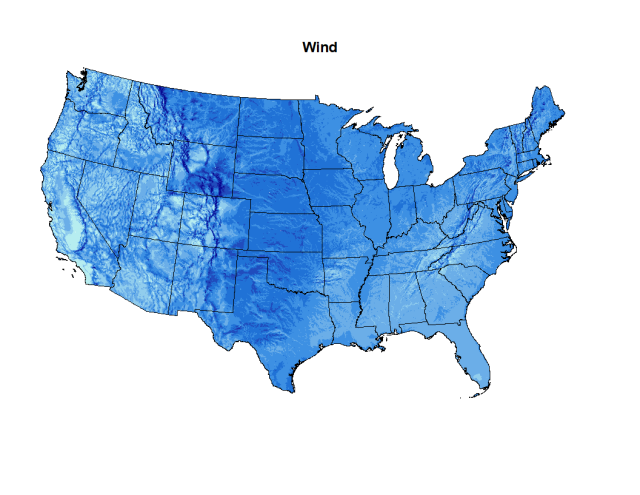
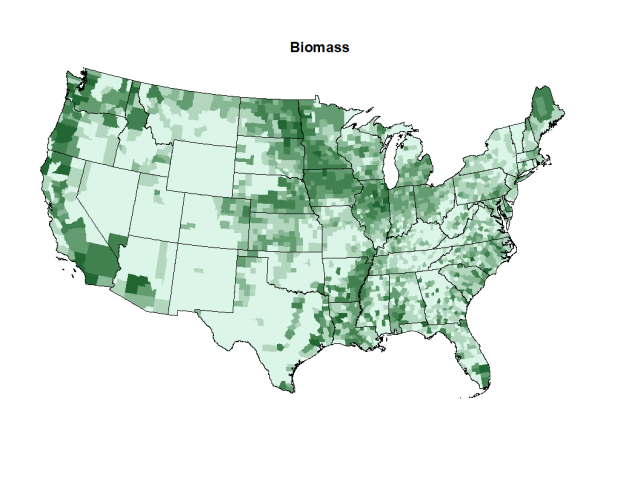
5.3 Screening Criteria
EPA and the National Laboratory of the Rockies (formerly the National Renewable Energy Laboratory) developed the following screening criteria to evaluate renewable energy potential. Planners should consider other critical factors for siting renewable energy facilities (e.g., slope) on a site-by-site basis.
| Renewable Energy Type and Scale | Estimated Renewable Energy Project Capacity Range | Renewable Energy Resource Availability | Acreage (Acres) | Distance to Transmission (Miles) | Distance to Graded Roads (Miles) |
|---|---|---|---|---|---|
| Utility scale PV | ≥ 5 MW | N/A | ≥ 35 | ≤ 10 | ≤ 10 |
| Distributed scale PV | < 5 MW | N/A | < 35 | N/A | N/A |
| Off-grid PV | N/A | N/A | N/A | N/A | N/A |
| Unknown acreage PV | N/A | N/A | N/A | N/A | N/A |
| Renewable Energy Type and Scale | Estimated Renewable Energy Project Capacity Range | Renewable Energy Resource Availability | Acreage (Acres) | Distance to Transmission (Miles) | Distance to Graded Roads (Miles) |
|---|---|---|---|---|---|
| Utility scale wind | ≥ 15 MW | 5.5 m/s at 80 m | ≥ 1,200 | ≤ 5 | ≤ 10 |
| Community scale wind | 1.5 MW - 15 MW | 5.5 m/s at 80 m | 40 - 1,200 | N/A | ≤ 1 |
| Facility scale wind | <1.5 MW | 5.0 m/s at 40 m | 0.5 - 40 | N/A | N/A |
| Unknown acreage wind**** | N/A | 5.5 m/s at 80 m | N/A | N/A | N/A |
| Renewable Energy Type and Scale | Estimated Renewable Energy Project Capacity Range | Renewable Energy Resource Availability | Acreage (Acres) | Distance to Transmission (Miles) | Distance to Graded Roads (Miles) |
|---|---|---|---|---|---|
| Biopower | > 10 MW | ≥ 150,000 (woody) | ≥ 6 | ≤ 10 | ≤ 3 road; ≤ 8 rail |
| Biorefinery | > 20 MMgal/year | ≥ 286,000 (herbaceous) | ≥ 132 | N/A | ≤ 3 road; ≤ 8 rail |
| Renewable Energy Type and Scale | Estimated Renewable Energy Project Capacity Range | Renewable Energy Resource Availability | Acreage (Acres) | Distance to Transmission (Miles) | Distance to Graded Roads (Miles) |
|---|---|---|---|---|---|
| Heat pump | Not Applicable | Absence of glacier or continuous permafrost | Acreage and distance variables are not included in the prescreening. | ||
The screening categories for wind and solar (other than off-grid) are based on a review of past and current projects. These guidelines can be used generally to screen sites, but more in-depth analysis should be used prior to making investment decisions. The main consideration for distinguishing between project potential is the relationship between size (based on acreage value) and relative distance to transmission lines. Transmission lines are typically defined as power lines with voltages greater than or equal to 69kV. Large capacity (>15 MW) projects require these high-voltage transmission lines to move large amounts of power. The larger a project, the greater the ability to absorb the cost of a long- distance connection to existing transmission and higher cost substations. Distributed generation projects (0–15 MW for wind and 0–2 MW for solar) are typically connected to power lines with distribution voltages less than 69 kilovolts (kV ); as such, for the purposes of this screening the criteria do not factor a distance to transmission for these projects. For example, smaller projects may be quite far from transmission lines, assuming there is distribution voltage infrastructure available. However, the distance to the nearest substation can be critical depending on project size. Existing generation on the feeder, which connects the consumer/load end with the substation, is also an important consideration. Coordination with the local utility is highly recommended when assessing the potential of a distributed generation project. [2], [3], [4]
Acreage is not a screening criterion for off-grid solar because such systems are typically used to power a single property or local area and are typically small enough that limited acreage is not a constraint. For example, a property owner could install PV panels to supplement the electricity provided to the site from traditional sources. In some cases, an off-grid system may power a given load (e.g., a small-scale pump and treat system).
Approximately 108,000 sites in EPA’s inventory do not include acreage values. These Acreage Unknown sites cannot be screened, but EPA does include sites that may potentially meet the resource criteria for wind and solar. Further investigation of these sites is required.
The total acreage required for a given wind project varies widely depending on total project capacity (MW), turbine type, resource strength, geographic region, power market and the cost of leasing land. Land requirements for single turbine projects are frequently driven by the requirement that the distance from the turbine to the property boundary be greater than the turbine tip height, which can go up to 500 feet for a utility scale turbine. Based on this criterion, minimum parcel sizes range from roughly an acre for a 100-kilowatt (kW) turbine (tip height 52 m) to roughly 7-8 acres for a utility scale turbine (tip height 150 m). These data illustrate the wide range of capacity densities that are found among wind installations in the United States. [5]
The main biomass feedstocks for power are paper mill residue, lumber mill scrap and municipal waste. For biomass fuels, the most common feedstocks are corn grain (for ethanol) and soybeans (for biodiesel).[6] See additional sources on biopower screening criteria. [7], [8]
Acreage is not a screening criterion for geothermal heat pumps because they have a small, primarily subterranean footprint. Typically, any site with existing or planned buildings or that has other heating or cooling needs (e.g., office buildings, warehouses or greenhouses) could be considered for geothermal heat pumps. Near surface temperatures of 10° C (50° F) to 24° C (75° F) are most suitable for geothermal heat pumps but were not considered for prescreening criteria. Additionally, geothermal heat pumps should not be cited on permafrost locations, which only impacts sites in Alaska. For general information about geothermal heat pumps see additional sources. [9], [10]
5.4 State Policies
The economic viability of renewable energy projects is closely tied to the policy context of the jurisdiction in which the projects are sited. States have adopted numerous policies to support greater investment in renewable technologies. The RE-Powering Mapper includes a layer with common types of policies that support or can be conducive to renewable energy at the state level. These policies are described in more detail below, and the Mapper values for each policy are listed in the table at the end of this section. [11]
Renewable Portfolio Standard: An RPS establishes the minimum percentage of electricity supplied within the state each year that comes from eligible renewable sources, such as wind, solar, geothermal and certain types of biomass, biogas and hydropower. The list of eligible resources varies from state to state. An RPS can be mandatory or voluntary. Voluntary RPS are also called RPS goals, as opposed to requirements. In states with mandatory RPS, electricity suppliers must include at least the required level of renewable sources in their supply mix each year or be faced with making alternative compliance payments for their shortfalls.
Thirty states, the District of Columbia, Puerto Rico and the U.S. Virgin Islands have adopted a mandatory RPS, and additional states have voluntary RPS policies [12].Several states have also included sub-requirements (or “carve-outs”) within their RPS for specific technologies such as solar PV. According to the National Laboratory of the Rockies, RPS policies have been one of the primary policy drivers for the growth of renewable energy over the last two decades in the United States, alongside federal tax credits like the investment tax credit and production tax credit. [13]
Clean Energy Standard: A CES is like an RPS but “may include low-carbon or otherwise low-polluting, non-renewable electricity sources.”[14] Five states have a mandatory standard, while additional states have CES goals.[15]
Deregulated Retail Electricity Market: A deregulated retail electricity market, also called a competitive generation and transmission market, is one in which electricity end-users can choose a supplier of G&T for their home, business or government agency. End-users will still have the delivery or distribution part of their electricity service provided by the local electric utility. A total of 17 states and the District of Columbia offer at least some degree of a deregulated retail electricity market.[16] Deregulated markets can be beneficial to renewable energy development because they may offer additional options for including renewable electricity in customers’ supply.
Markets that are not deregulated generally follow the traditional “vertically-integrated utility” structure, with the local utility providing bundled electricity service including generation, transmission and distribution. However, vertically integrated utilities increasingly offer more renewable options, through “green tariffs” or other mechanisms.[17]
Community Choice Aggregation (CCA) Market: CCA allows local governments to procure electricity on behalf of residents, businesses and governmental end-users, which still receive power delivery from the local electric utility. A CCA market is similar to a deregulated retail electricity market in some ways, but with a local government-established entity serving as the supplier in place of a competitive supplier. Ten states have CCA legislation.[18] Depending on local government priorities, a CCA market may emphasize renewable energy procurement to a greater degree than the prior market structure or the state RPS or CES.
Traditional Net Metering: Net metering, or net energy metering, policies “are established at the state or local utility level and define both (1) what size and other characteristics of generation projects interconnected with household or business customer meters are eligible for compensation from the utility for excess production (above what is consumed on-site), and (2) what compensation they receive for such excess production.”[19] To the extent that net metering policies provide ready means and/or high levels of compensation for excess production, they can be supportive of renewable energy development.[20] Thirty-nine states, the District of Columbia, Puerto Rico and the U.S. Virgin Islands presently have some form of mandatory net metering rules. Eight states have or are in transition to compensation rules other than traditional net metering.[21]
Distributed Generation Compensation Rules other than Net Metering: Increasingly, states are starting to phase out traditional net metering programs and are adopting a range of successor policy designs. These changes are driven by concerns about the overall cost of traditional net metering to utility ratepayers, cost allocation between net metering participants (e.g., with on-site solar projects) and non-participants, a desire to better tailor compensation based on project location, and other factors.[22] Five states have distributed generation compensation rules other than traditional net metering, and another five states are transitioning to such policies.[23]
Community Solar: “Community solar, also known as shared solar or solar gardens, allows customers to buy or lease part of a larger, off-site shared solar PV system and receive benefits of their participation.”[24] By doing so, community solar policies can greatly increase customer access to solar for electricity users beyond those that are candidates for on-site projects. Community solar projects tend to be 5 MW or less in capacity and, therefore, are similar to the typical scale of RE-Powering projects.[25] “Twenty states (and the District of Columbia) have passed some form of legislation enabling community solar, either through statewide programs or the authorization of a limited number of pilot projects.”[26]
RE-Powering State Policy: Certain states have adopted policies or regulations specifically targeted at reuse of contaminated lands, landfills and/or mine sites for renewable energy. These are labeled as “RE-Powering State Policies” and cover the following types of policies: financial incentives, procurement preferences or requirements and streamlined permitting or environmental reviews. States with such policies tend to have the highest levels of deployment of RE-Powering projects. The annual tracking matrix published by the RE-Powering Office contains additional information on these policies.[27]
Completed Renewable Energy Projects on RE-Powering Sites: The RE-Powering Office publishes an annual tracking matrix of known projects that have been completed on contaminated lands, landfills and mine sites. The number of renewable energy projects completed in each state reflects, in part, the state policies in effect to encourage development on these types of sites. There are currently over 600 and counting installations in multiple states and territories, and over 4 gigawatts of capacity.[28]
The following information is included in the Mapper as a state policies layer:
| State Policy Name | Policy Short Definition | Mapper Values | Source | Date Accessed |
|---|---|---|---|---|
| Renewable Portfolio Standard | States with a mandatory or voluntary standard indicating the percentage of electricity supply from renewable sources | “Yes” if mandatory RPS is in state, “Goal” for voluntary RPS, and “No” for no RPS | NCCETC, DSIRE®, Renewable & Clean Energy Standards | 6/2021 |
| Clean Energy Standard | States with a mandatory or voluntary standard indicating the percentage of electricity supply from clean sources | “Yes” if mandatory CES is in state, “Goal” for voluntary CES, and “No” for no CES | NCCETC, DSIRE®, Renewable & Clean Energy Standards | 6/2021 |
| Deregulated Retail Electricity Market | State electricity markets that are deregulated (i.e., competitive markets for generation and transmission for retail customers) | Yes/No – “Yes” if state has a deregulated retail electricity market | EPA, Understanding Electricity Market Frameworks & Policies | 6/2021 |
| Community Choice Aggregation Market | States with legislation that specifically allows CCA statewide or in specific markets | Yes/No – “Yes” if state allows CCA | LEAN, CCA by State | 6/2021 |
| Traditional Net Metering | States have traditional net metering compensation mechanisms, in at least some utilities, for renewable electricity projects at retail customer sites | Yes/No – “Yes” if state has traditional net metering rules | NCCETC, DSIRE®, Renewable & Clean Energy Standards | 9/2021 |
| Distributed Generation Compensation Rules other than Net Metering | States with DG compensation rules other than traditional net metering in place or that are in the process of transitioning to such rules | Yes/No – “Yes” if state has DG compensation rules other than traditional net metering in place or is transitioning to them | NCCETC, DSIRE®, Renewable & Clean Energy Standards | 9/2021 |
| Community Solar | State has legislation enabling statewide community solar programs or pilot projects | Yes/No – “Yes” if state has community solar legislation | National Laboratory of the Rockies, Community Solar 101, p. 28 (pdf) | 6/2021 |
| State RE-Powering Policy | States that encourage, through specific policies or regulations, renewable energy on contaminated lands, landfills and/or mine sites | Yes/No – “Yes” if state has RE-Powering policy | EPA, RE-Powering Tracking Matrix | 6/2021 |
| Completed Renewable Energy Projects on RE-Powering Sites | The total number of completed renewable energy projects on contaminated lands, landfills and mine sites (collectively “RE-Powering sites”) in the state known to and recorded by the RE-Powering Office as of its most recent Tracking Matrix | Number of known renewable energy projects on Re-Powering sites in the state | EPA, RE-Powering Tracking Matrix | 10/2021 |
5.5 Screening Methodology and Constraints
EPA screened all sites by comparing the site location with renewable energy resources. Specific renewable energy technology type, site size and proximity to infrastructure criteria are applied to give the Mapper user a high-level indication of sites with likely renewable energy potential. These criteria are described in the Screening Criteria section of this document.
As noted in the Overview section of this site, this analysis represents an initial screening, and planners should investigate sites further for both technical and economic feasibility. For example, although slope is a critical factor for siting some types of renewable energy, it was not considered in the analysis due to limitations in the availability of high-resolution slope data for sites dispersed across the United States. Site-specific slope analysis should be performed for any site being considered for renewable energy development.
EPA validated sites by identifying and eliminating those with potentially incorrect spatial reference data. If mapped locations did not match state data as recorded, they were excluded from the analysis.
EPA removed sites that appeared to be residential sites from consideration in the dataset.
EPA also considered duplication in developing the full dataset. In instances where a state-tracked site was also in an EPA database, that site was removed from the state dataset. Additionally, if a property was listed in a state-tracked database multiple times (e.g., multiple responses at a single property), it was revised to only be included once per property. One exception is EPA Superfund and RCRA sites; if a site is designated as both, it is included twice in the data. It is likely that some unidentified duplicates still exist in the dataset.
For the LUST program, 50 sites are being piloted in the RE-Powering Mapper and are a very small subset of the entire LUST universe. These 50 LUST sites are considered active releases located at inactive facilities The national universe of UST and LUST sites can be found in EPA’s UST Finder.
EPA performed all screening on site polygons, i.e., sites with area over which a renewable resource can be assessed. Polygon site boundary files are not consistently available, so EPA collected data in both point and polygon ESRI shapefile format. Some site boundary polygons for Superfund (National Priorities List) sites were available and used for screening. State-tracked sites were provided as polygons in these state programs: Colorado Institutional Control, Colorado Uranium Mill Tailings Radiation Control Act, Florida Brownfield, Florida Institutional Control Registry, Missouri Abandoned Mine Land, Missouri Industrial Minerals Unit, Missouri Metallic Minerals Unit, New Jersey Solid & Hazardous Waste, New York Environmental Site Remediation Program, North Carolina Brownfield Projects, Oregon DEQ Environmental Cleanup Program, Pennsylvania Abandoned Coal Mine Lands, Virginia Abandoned Coal Mine Areas, Virginia Orphan Land Program and West Virginia Abandoned Coal Mine Areas.
Those polygons were used as is, and the remaining site boundaries were estimated. To approximate the site size/boundary and estimate the potential for renewable energy generation across an entire site, EPA mapped the site latitude and longitude point and drew a circular buffer corresponding to the area reported around that latitude/longitude point. The maximum renewable energy resource values were recorded for these areas. Sites are typically not circular, and latitude and longitude are not always recorded at the geographic center of the site. Despite these limitations, the method employed allows for a more accurate snapshot of the energy potential available at the site versus a single data point.
For sites that did not have acreage size reported, a minimal acreage buffer was generated using a radius of 0.01 meters (approximately 0.03 feet); the buffer was approximately 0.00000007 acres. This allowed for consistent geoprocessing across the datasets and gave each property a small footprint.
Except for Puerto Rico and the Virgin Islands, U.S. territories were not evaluated or included in this analysis because renewable energy resource and transmission data were not readily available for these territories. Other limitations to the datasets are as follows. Biomass, geothermal near surface temperature and rail data were not readily available for Puerto Rico and the Virgin Islands. Geothermal near surface temperature data are limited for Alaska and Hawai’i. A similar wind dataset was not readily available for Alaska, Puerto Rico or the Virgin Islands. Transmission line and substation data was not readily available for the Virgin Islands.
Acreage values for each site might not represent available land or the total contaminated area. For example, some sites are listed “fence to fence,” which encompasses the entire facility, rather than only the contaminated portions of the facility. As such, the potentially or formerly contaminated areas may represent only a portion of the total acreage of these sites. In addition, acreage values do not consider the physical characteristics at the site (e.g., buildings, topography, tree cover) and, thus, may not represent the true usable acreage of the site.
For the biomass analysis, note that the resources are evaluated within a 50- mile radius of the site. Therefore, EPA drew a 50-mile buffer around the actual or modeled site boundary and recorded the sum of the biomass resource within 50 miles of the site.
Distances were calculated using GIS software to determine the proximity of the site boundary to specific infrastructure. In instances where distances to transmission lines, highways or rails are zero, the transmission line, highway or rail intersects the site buffer, meaning that the infrastructure is present within the site boundary. Because these distances were calculated using GIS software, they may not reflect real-world conditions or distances due to inaccurate or incomplete geospatial datasets and topography.
5.6 Screening Datasets
EPA compiled and used the following geospatial data to perform the screening.
5.6.1 National Laboratory of the Rockies Data
Solar, wind and biomass resource data was obtained.
| Resource Name | Description of Dataset Used in Analysis | Date of Access |
|---|---|---|
| Global Horizontal Irradiance Re-source 1998 to 2019 | Provides annual average of the daily total solar resource using 1998-2019 data covering 0.038-degree latitude by 0.038-degree longitude. Source: Sengupta, Manajit, Yu Xie, Anthony Lopez, Aron Habte, Galen Maclaurin, and James Shelby. “The National Solar Radiation Data Base.” Renewable and Sustainable Energy Reviews 89 (2018): 51–60. For more information visit: The National Solar Radiation Data Base. | 7/2021 |
| Solid Biomass | Contains information about the biomass resources generated by county in the United States. Includes the following feedstock categories: crop residues, forest residues, primary mill residues, secondary mill residues and urban wood waste. Used to determine potential for biorefinery and biopower facility siting. Data available for all jurisdictions except for Puerto Rico and Virgin Islands. Source: National Laboratory of the Rockies Biomass Data. | 7/2021 |
| The National Laboratory of the Rockies WIND Toolkit | The WIND Toolkit includes meteorological conditions and turbine power for sites in the continental United States for the years 2007–2013. Source: Draxl, Caroline, Andrew Clifton, Bri-Mathias Hodge, and Jim McCaa. “The Wind Integration National Dataset (WIND) Toolkit.” Applied Energy 151 (2015): 355–66. | 7/2021 |
| Hawai’i Wind | Wind speed resource data at heights of 40 and 80 meters, the data encompasses annual average wind speeds for 2000-2019 inclusive. Source: Optis, Michael, Rybchuk, Oleksa, Bodini, Nicola, Ros-sol, Michael, and Musial, Walter. “2020 Offshore Wind Resource Assessment for the California Pacific Outer Continental Shelf (pdf)”. United States. | 7/2021 |
5.6.2 Census Data
Distances to rails and roads were obtained from U.S. Census Bureau.
| Resource Name | Description of Dataset Used in Analysis | Date of Access |
|---|---|---|
| Rails | Includes main lines such as spur lines, rail yards, mass transit rail lines (such as carlines), streetcar track, monorail or other mass transit rail and special purpose rail lines such as cog rail lines, incline rail lines and trams. Extracted from the U.S. Census Bureau's Master Address File / Topologically Integrated Geographic Encoding and Referencing (MAF/TIGER) Database. Source: Census TIGER Files. | 7/2021 |
| Primary and Secondary Roads - Puerto Rico | Includes primary and secondary roads extracted from the U.S. Census Bureau's MAF/TIGER MTDB. Primary roads are generally divided, limited-access highways within the Interstate Highway System or under state management, and are distinguished by the presence of interchanges. Secondary roads are main arteries, usually in the U.S. Highway, State Highway and/or County Highway system. These roads have one or more lanes of traffic in each direction, may or may not be divided, and usually have at-grade intersections with many other roads and driveways. Source: Census TIGER Files. | 7/2021 |
| Primary and Secondary Roads - Virgin Islands | Includes primary and secondary roads extracted from the U.S. Census Bureau's MAF/TIGER MTDB. Primary roads are generally divided, limited-access highways within the Interstate Highway System or under state management, and are distinguished by the presence of interchanges. Secondary roads are main arteries, usually in the U.S. Highway, State Highway, and/or County Highway system. These roads have one or more lanes of traffic in each direction, may or may not be divided, and usually have at-grade intersections with many other roads and driveways. Source: Census TIGER Files. | 7/2021 |
5.6.3 Homeland Infrastructure Foundation Level Data (HIFLD) Open Data
Distances to transmission lines and substations were obtained from HIFLD Open Data. HIFLD Open Data provides national foundation-level geospatial data within the open public domain.
| Resource Name | Description of Dataset Used in Analysis | Date of Access |
|---|---|---|
| Electric Power Transmission Lines | This feature class/shapefile represents electric power transmission lines. Transmission lines are the system of structures, wires, insulators and associated hardware that carry electric energy from one point to another in an electric power system. Lines are operated at relatively high volt-ages varying from 69 kV up to 765 kV and are capable of transmitting large quantities of electricity over long distances. Underground transmission lines are included where sources were available. The following updates have been made since the previous release: 6,457 features added. Source: HILFD Open Data. | 7/2021 |
| Electric Substations | This feature class/shapefile is for HIFLD as well as the Energy modelling and simulation community. This feature class/shapefile represents electric power substations primarily associated with electric power transmission. In this layer, substations are considered facilities and equipment that switch, transform or regulate electric power at voltages equal to, or greater than, 69 kilovolts. Substations with a maximum operating voltage less than 69 kilovolts may be included, depending on the availability of authoritative sources, but coverage of these features should not be considered complete. Source: HILFD Open Data. | 7/2021 |
5.6.4 Southern Methodist University Data
Surface temperature data for geothermal heat pumps were obtained from SMU.
| Resource Name | Description of Dataset Used in Analysis | Date of Access |
|---|---|---|
| Surface Temperature | Grid depth information was obtained from SMU on June 27, 2009. Source: Dr. David Black-well, Maria Richards and Petru Negraru, 2006, SMU Geothermal Laboratory Temperature Maps. | 7/2021 |
5.6.5 ESRI Data
Distances to roads were obtained from Esri Data and Maps 2021.
| Resource Name | Description of Dataset Used in Analysis | Date of Access |
|---|---|---|
| U.S. Highways | U.S. Highways represents the major and minor highways of the United States. These include interstates, U.S. highways, state highways, major roads and minor roads. This dataset is from the Census 2000 TIGER/Line files. Source: Esri. | 7/2021 |
5.6.6 University of Alaska
EPA obtained permafrost data from the University of Alaska.
| Resource Name | Description of Dataset Used in Analysis | Date of Access |
|---|---|---|
| Permafrost Characteristics of Alaska | Identifies glacier and permafrost locations across Alaska. Source: Torre Jorgenson et al.2008. “Permafrost Characteristics of Alaska” Institute of Northern Engineering, University of Alaska Fairbanks. 2008. | 7/2021 |
Footnotes
2 Source: Bank, J. et al. High Penetration Photovoltaic Case Study Report. No. NREL/TP-5500-54742. NREL, Golden, CO (United States), 2013 (pdf).
3 Source for PV Cost: 2017 Cost Benchmark (pdf).
4 Source: Interconnection Plugging RE-Powering Sites Into the Electric Grid, EPA, 2019.
6 Source: NREL Biomass Energy Basics.
8 Biofuels criteria furnished by Gregg Tomberlin, Senior Engineer, National Laboratory of the Rockies.
9 Source: DOE Geothermal Heat Pumps.
11 For information on a broader range of state policies for renewable energy, the NC Clean Energy Technology Center (NCCETC) maintains the Database of State Incentives for Renewables & Efficiency® (DSIRE®). Readers interested in learning about state policies specific to contaminated lands, landfills and mine sites can contact EPA’s RE-Powering office.
12 Lawrence Berkeley National Laboratory, U.S. Renewables Portfolio Standards 2021 Status Update: Early Release, p. 9 (pdf); and NCCETC, DSIRE®, Renewable & Clean Energy Standards (pdf).
13 LBNL, U.S. Renewables Portfolio Standards 2021 Status Update: Early Release, p. 16 (pdf).
14 U.S. Department of Agriculture, Renewable Energy Trends, Options, and Potentials for Agriculture, Forestry, and Rural America, p. 28 (pdf).
15 NCCETC, DSIRE®, Renewable & Clean Energy Standards (pdf).
16 U.S. Environmental Protection Agency, Understanding Electricity Market Frameworks & Policies.
17 See, for example, EPA, Green Power Partnership: Utility Green Tariffs.
18 Local Energy Aggregation Network, CCA by State.
20 “There also are ‘virtual net metering’ (or ‘meter aggregation’) arrangements in some cases that allow customers with multiple electricity meters with a utility to transfer excess solar production between the meters for billing purposes.” USDA, Renewable Energy Trends, Options, and Potentials for Agriculture, Forestry, and Rural America, p. 90 (pdf). Virtual net metering policies also vary by state and utility and can be conducive to renewable energy development by separating the site of electricity production from the site of electricity consumption.
21 NCCETC, DSIRE®, Net Metering (pdf).
22 For more information on this topic, see National Regulatory Research Institute, Review of State Net Energy Metering and Successor Rate Designs (pdf).
23 NCCETC, DSIRE®, Net Metering (pdf).
24 NREL, Community Solar 101, p. 3 (pdf).
25 For more information on community solar policies as they relate to RE-Powering sites, see EPA, Community Solar: An Opportunity to Enhance Sustainable Development on Landfills and Other Contaminated Sites.
26 National Laboratory of the Rockies, Community Solar 101, p. 28 (pdf).
27 EPA, RE-Powering Tracking Matrix.
28 EPA, RE-Powering Tracking Matrix.