
EPA Scientists Update REal TIme Geospatial Data Viewer (RETIGO) Web Tool
Published August 7, 2024
EPA’s REal TIme Geospatial Data Viewer (RETIGO) is a free, open-access web tool that can be used to explore air quality data collected via stationary or in-motion sensors. The tool allows users to plot their air quality data and view it alongside data from EPA monitors, public air sensors, meteorological stations, and satellites.
RETIGO uses user-supplied mobile or stationary data files containing timestamps, latitude, longitude, and pollutant/environmental variables to create interactive maps and time series displays. These visuals show information such as how pollution varies by location and during time of day, and how pollution levels change with wind speed and direction.
EPA scientists updated RETIGO to include new data sources and new functionality designed to allow a variety of public and professional users to quickly display and explore their air quality data. “It is important for RETIGO to continually update and integrate new data sources as they become available. This way researchers and the public can continue using the best available geospatial air quality data for their analyses,” said EPA air quality researcher Amara Holder.
The following updates were made to the RETIGO interface:
- Customizable display colors and scales for individualized datasets.
- Advanced visual satellite data overlays that allow users to display multiple datasets on a single map.
- Increased visualization options such as three-dimensional data viewing and the ability to export data for visualization in other platforms like Google Earth.
- New scatterplot function that allows user control of plot options.
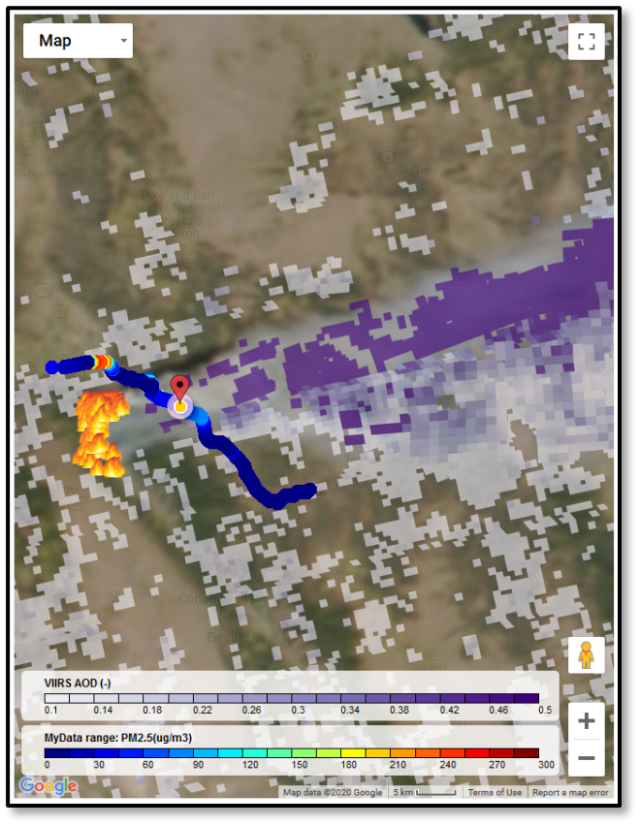
- New comparison data and new satellite data sources that integrate data from the Visible Infrared Imaging Radiometer Suite (VIIRS), which includes aerosol optical depth (AOD) data and VIIRS true-color imagery, data from the European Space Agency (ESA) Tropospheric Monitoring Instrument (TROPOMI), fire detections from the National Oceanic and Atmospheric Administration (NOAA) Hazard Mapping System (HMS), and more.
RETIGO for Air Quality
RETIGO provides a portal that efficiently condenses and displays large data deposits.
Holder uses RETIGO in her capacity as an Air Resource Advisor (ARA) Trainee. ARAs are technical specialists who provide expertise on wildfire smoke and they serve communities and first responders by conducting smoke monitoring, modeling, forecasting, and communicating these analyses to stakeholders.
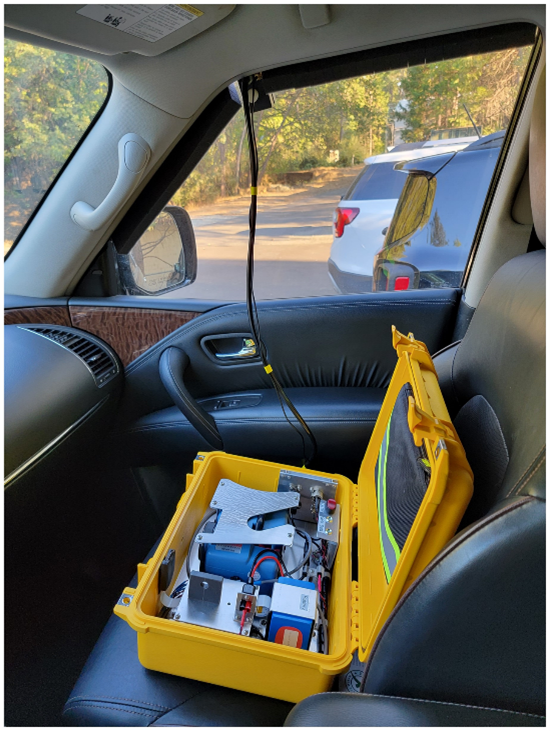
Holder also uses RETIGO to visualize data collected through the Wildfire Smoke Air Monitoring Response Technology Program (WSMART). As part of the WSMART program, researchers developed a compact mobile monitor to measure the distribution of wildfire smoke near fires. They designed the data output from this instrument to be formatted and ready for display on RETIGO to provide an accessible and rapid way to view smoke concentrations, which is useful in active wildfire situations.
RETIGO is unique in that it allows users to combine fire updates and air quality information derived from multiple sources (such as satellites, monitoring networks) and overlay that with real time data collected by mobile monitors. The new RETIGO updates are invaluable for ARAs like Holder, as they expand the use and accessibility of the tool:
- Fire detections from the NOAA HMS, AOD data and VIIRS true-color imagery.
- Multiple color bar options.
- The option to export files that code for geographic representation in two- and three-dimensional web models.
These features allow ARAs to create and analyze three-dimensional output models on Google Earth and directly compare their observations with satellite data.
“With the rise in lower-cost sensors and other easy-to-use measurement technologies, air quality data has become easier to collect; however, these technologies can produce huge amounts of data that can be daunting to analyze. RETIGO helps scientists get over that analysis hurdle and rapidly turn air quality data into meaningful results that can be used to inform public health guidance or make air quality management decisions that ultimately protect human health and the environment,” Holder noted.
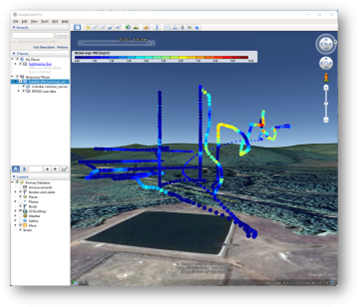
Other researchers, such as EPA’s Brian Gullett, use RETIGO to create three-dimensional visualizations showing air pollution concentrations over the flight paths of unmanned aircraft systems (UAS, or “drones”). RETIGO’s updated functions allow users to create three-dimensional, color coded renderings depicting particle concentration levels, meteorological data, and sample-site topography. Gullett and EPA partners from NOAA are currently using RETIGO to map the paths and concentrations of plumes from wildland fires and oil fires.
“With this tool, we can move the plume in Google Earth to visualize its shape and understand its dispersion characteristics,” Gullett said. “This is an important tool for improving dispersion models which are used to respond to accidents, protect worker safety, and warn downwind populations of potential inhalation hazards.”
The RETIGO of Today and Tomorrow
With more individuals and groups collecting environmental measurements because of emerging air sensing technologies, RETIGO’s updated data viewer fills a research and data compilation gap for air quality professionals and citizen scientists. In the past, plotting large air quality data inputs could require extensive technical training, and visualizations were often messy two-dimensional renderings. EPA scientists have designed RETIGO to reduce technical barriers in data visualization and allow for widespread data sharing. The tool will continue to be updated to reflect the impact of emerging technologies and provide users with a highly accessible, multifunctional data viewer.
This article was written by Sarah Whichello, Oak Ridge Associated Universities Research Participant with EPA.