
U.S. Recycling Infrastructure Assessment and State Data Collection Reports
On this page:
- Background
- Recycling Infrastructure Assessment
- Recycling Needs Survey and Assessment
- Related Tools and Resources
Background
In 2021, Congress instructed EPA to collect data on residential recycling as well as estimate the financial investments needed to modernize the U.S. recycling system. In 2024, using an electronic information collection request (E-ICR), EPA began the comprehensive data collection in 2021 and completed a summary report, “Recycling Needs Survey and Assessment.” EPA also analyzed the nation’s current recycling infrastructure stock and gaps and completed its “Recycling Infrastructure Assessment” report in 2024.
Recycling Infrastructure Assessment
In its report, “An Assessment of the U.S. Recycling System: Financial Estimates to Modernize Material Recovery Infrastructure,” EPA estimates an investment of $36.5 to $43.4 billion is needed to improve curbside collection, drop-off, and processing infrastructure, including material recovery facilities, packaging material recycling facilities, composting, anaerobic digestion, and livestock infrastructure.
Scope

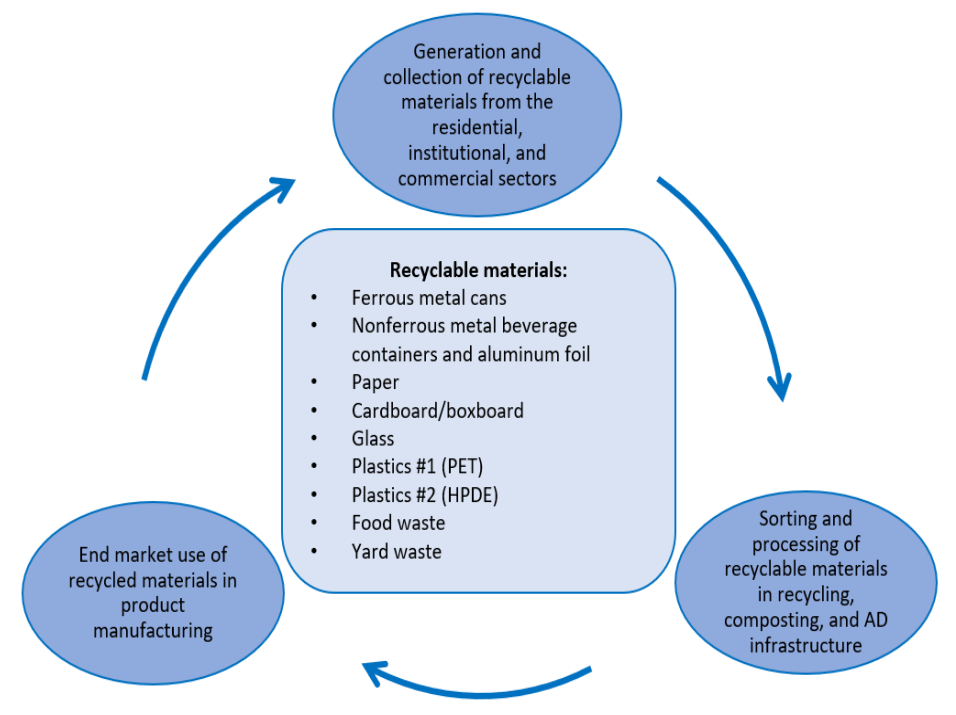
The scope of this assessment focuses on packaging and organic recyclable materials, also referred to as “commonly recycled materials,” including ferrous metal cans, nonferrous metal beverage containers, aluminum foil, paper, cardboard/boxboard, glass, plastics #1 & #2, and food and yard waste. These materials make up approximately 82% of the municipal solid waste stream and are therefore essential targets in providing communities with access to recycling services. These materials also have established end markets and proven, existing technologies to recycle at a national level, including mechanical technologies that process packaging materials through MRFs and organic materials through biological processes such as composting, anaerobic digestion, and livestock feed.
Methodology
EPA analyzed the current state of U.S. recycling infrastructure stock and gaps to identify how to modernize the recycling system, with a key focus on providing all residents with access to recycling services on par with access to trash disposal. EPA used the U.S. National Recycling Goal as a framework to measure the success of potential recycling investments. EPA conducted a literature review of 125 documents (proposals, reports, case studies, data sources, and more) that focus on key improvements and associated costs of strengthening the U.S. recycling system. EPA also conducted approximately 20 interviews with internal and external recycling subject matter experts.
Key Findings
The report estimates that an investment of $36.5 to $43.4 billion would be needed to improve curbside collection, drop-off, and processing infrastructure across the United States by 2030. This includes MRFs, packaging material-specific recycling facilities, composting, anaerobic digestion, and livestock infrastructure. Key investments must be made in all aspects of the national recycling system – generation, collection, sorting, processing, and end markets – along with education and policies that disincentivize landfilling materials. This level of investment could lead to the potential recovery of an additional 82 to 89 million tons of packaging and organic waste, which is a 91% increase in recovery from the estimated 94 million tons recycled and composted in EPA’s 2018 Facts and Figures report. This increased tonnage of recovered material could also raise the nation’s recycling rate from 32% to 61%, allowing EPA to surpass its nationwide recycling goal of 50% by 2030.
Table 1: Summary of Recycling Investment Needed by Cost Category for Packing Materials
| Cost Category | Education and Outreach Cost Estimate | Low- End Infrastructure Investment Cost Estimate | High-End Infrastructure Investment Cost Estimate | Rounded Total Investment Needed (Low vs. High end) |
|---|---|---|---|---|
| Curbside Collection | $1,008,741,285 | $18,905,264,244 | $20,444,264,244 | $19,900,000,000 - $21,500,000,000 |
| Glass Separation (Curbside) | $0 | $2,970,952,670 | $2,982,785,526 | $2,900,000,000 |
| Dropoff | $240,052,657 | $1,621,513,289 | $3,160,513,289 | $1,900,000,000 - $3,400,000,000 |
| Deposit Redemption System | $0 | $100,000,000 | $100,000,000 | $100,000,000 |
| Curbside + Dropoff | $1,248,793,942 | $20,526,777,533 | $23,604,777,533 | $21,800,000,000 - $24,900,000,000 |
| Curbside + Dropoff + Deposit Redemption System | $1,248,793,942 | $20,626,777,533 | $23,704,777,533 | $21,900,000,000 - $25,000,000,000 |
| Curbside + Dropoff + Glass Separation | $1,248,793,942 | $23,497,730,203 | $26,587,563,060 | $24,700,000,000 - $27,800,000,000 |
| Curbside + Dropoff + Glass Separation + Deposit Redemption System | $1,248,793,942 | $23,597,730,203 | $26,687,563,060 | $24,800,000,000 - $27,900,000,000 |
| Packing Materials Totals | $6,243,969,710 | $111,846,745,675 | $127,272,244,245 | $118,000,000,000 - $133,500,000,000 |
Table 2: Summary of Recycling Investment Needed by Cost Category for Organic Materials
| Cost Category | Education and Outreach Cost Estimate | Low- End Infrastructure Investment Cost Estimate | High-End Infrastructure Investment Cost Estimate | Rounded Total Investment Needed (Low vs. High end) |
|---|---|---|---|---|
| At-Home Composting | $91,686,738 | $288,058,151 | $288,058,151 | $380,000,000 |
| Community Composting | $1,248,793,942 | $3,437,278,439 | $3,437,278,439 | $4,700,000,000 |
| Centralized Composting | $1,017,159,961 | $7,646,855,698 | $8,383,184,613 | $8,700,000,000 - $9,400,000,000 |
| Centralized Anaerobic Digestion | $8,418,676 | $413,454,126 | $427,766,868 | $422,000,000 - $436,000,000 |
| Water Resource Recovery Facility (WRRF) Anaerobic Digestion | $8,418,676 | $68,280,902 | $87,417,926 | $77,000,000 - $96,000,000 |
| Animal Feed | $0 | $448,086,813 | $503,686,267 | $449,000,000 - $504,000,000 |
| Organics Totals | $2,374,477,993 | $12,302,014,129 | $13,127,392,264 | $14,700,000,000 - $15,500,000,000 |
Recycling Needs Survey and Report
Under OMB Control No. 2050-0225, EPA undertook a data collection effort to strengthen residential recycling and accelerate the move towards a circular economy.
Key findings include:
- Approximately 50 percent of states and territories collect data on the number of community curbside recycling programs while just over 60 percent collect data on the number of drop-off programs.
- 80 percent of states and territories do not have deposit programs. Of those that do have deposit programs, two thirds collect data on the amount of residential packaging materials collected through the programs.
- Only 15 percent of states and territories collect data on the capture rates of community recycling programs.
- 88 percent of states and territories do not collect data on the type of single-use plastics currently in commerce.
- About 50 percent of states and territories measure an overall recycling rate, with an average recycling rate estimate of roughly 30 percent.
- The most common materials accepted by the majority of state and territory recycling programs are paper products, high-density polyethylene (HDPE) plastics (plastic type 2), polyethylene terephthalate (PET) plastics (plastic type 1), and aluminum.
Read the Recycling Needs Survey and Assessment (pdf) .
Related Tools and Resources
- Facts and Figures about Materials, Waste and Recycling.
- Excess Food Opportunities Map.
- Recycling Economic Information Report.
- U.S. National Recycling Goal.
- National Recycling Strategy.
- Infrastructure Investment and Jobs Act: Transforming U.S. Recycling and Waste Management.
- Model Recycling Program Toolkit.