U.S. flag

An official website of the United States government

Here’s how you know

Dot gov

Official websites use .gov
A .gov website belongs to an official government organization in the United States.

HTTPS

Secure .gov websites use HTTPS
A lock (LockA locked padlock) or https:// means you’ve safely connected to the .gov website. Share sensitive information only on official, secure websites.

    • Environmental Topics
    • Air
    • Bed Bugs
    • Cancer
    • Chemicals, Toxics, and Pesticide
    • Emergency Response
    • Environmental Information by Location
    • Health
    • Land, Waste, and Cleanup
    • Lead
    • Mold
    • Radon
    • Research
    • Science Topics
    • Water Topics
    • A-Z Topic Index
    • Laws & Regulations
    • By Business Sector
    • By Topic
    • Compliance
    • Enforcement
    • Laws and Executive Orders
    • Regulations
    • Report a Violation
    • Environmental Violations
    • Fraud, Waste or Abuse
    • About EPA
    • Our Mission and What We Do
    • Headquarters Offices
    • Regional Offices
    • Labs and Research Centers
    • Planning, Budget, and Results
    • Organization Chart
    • EPA History

Breadcrumb

  1. Home
  2. Water Research

Freshwater Explorer

Person fishes in a river near a mountain slope
Photo Courtesy of Douglas Norton

On This Page:

  • Compatibility and Availability
  • Capabilities
  • Applications
  • Quick Guide
  • Background Information
  • Related Resources

Access Freshwater Explorer (Version 2.0)


A tool for exploring the water quality of freshwater resources

Link, Freshwater Explorer 2.0 home screen
Click on the map to launch Freshwater Explorer 2.0.

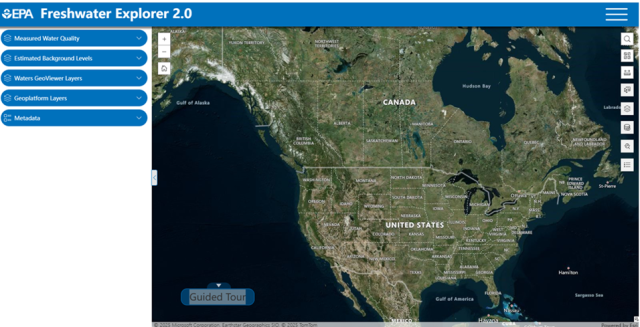
EPA's Freshwater Explorer is an interactive web-based mapping tool for water quality parameters of freshwater streams, lakes, and groundwater wells in all 50 U.S. states, Puerto Rico, and the U.S. Virgin Islands. It includes both observed data points and estimated background concentrations to make it easy to identify areas where water quality has been impacted by human activities. It can be used by  citizens and non-governmental organizations, to better understand national and local water quality issues and to provide water quality information to help federal, state, territory, Tribal, and local partners make decisions about freshwater resources. Users can add spatial layers to explore associations between water quality measurements and natural and human geographical factors and any of the more than 10,000 other available data layers accessible from the GeoPlatform that may affect water quality in the United States.

Freshwater Explorer 2.0, the clean-up procedures, and curated data layers were designed so that states, Tribes, businesses, industries, and everyday American citizens can leverage national data sets to better enable environmental protection empowered by federalism. The work achieves this goal by 1) providing semiautomated clean-up procedures to harmonize data from state and federal sources, 2) providing curated data sets so states are not limited to only their own data, and 3) providing a mapping tool to visualize different kinds of data. These data may be used to characterize background water quality to develop stressor-response relationships or evidence for condition, causal, and risk assessments after taking into consideration application specific data quality needs. These data layers allow states and industry to download the data for analysis, strategic planning, and decision making.

Compatibility and Availability

The Freshwater Explorer is map-centric and mobile-friendly. It works on all screen sizes, from desktop computers and tablets to mobile phones. The application can be downloaded to a third-party PC with full access to modify it with an ArcGIS account.

Preferred citation:  Wharton C., Olson J., Newcomer-Johnson, T., Cormier S. 2025. U.S. EPA Freshwater Explore V2. United States Environmental Protection Agency. April 2025. https://arcg.is/Xfneu

Capabilities

Ask an Expert

For questions, comments, or suggestions, contact us at FreshwaterExplorer@epa.gov.

Freshwater Explorer Version 2.0 includes summary statistics for 11 commonly sampled water quality parameters for approximately 289,000 stream locations, 10,000 lakes, and 50,000 groundwater wells. To date they are: 

  • alkalinity
  • ammonia
  • calcium
  • chlorophyll a
  • chloride
  • conductivity
  • organic carbon
  • pH
  • sulfate
  • total phosphorus
  • total nitrogen

Users can now perform complex searches and more easily add or download data. They can also modify a customizable map and pull in data from other EPA sources, such as ECHO (Enforcement Compliance History Online) and ATTAINS (Assessment Total Maximum Daily Load [TMDL] Tracking and Implementation System).

Water Quality Portal (WQP) data from Water Quality Exchange (WQX)

The Freshwater Explorer 2.0 effectively curates and summarizes the vast array of water quality data records available in the Water Quality Portal (WQP), which encompasses hundreds of millions of entries. Over 500 federal, state, Tribal, and other partners have contributed their data to the WQP through the Water Quality Exchange. 

The tool was developed to help users visualize water quality datasets with color-coded displays. EPA compiled and curated data from the WQP using Tools for Automated Data Analysis (TADA). EPA further curated the TADA output, removing some and tagging very low or high values submitted by contributors. However, data still include undetected errors of magnitude and location, and therefore, the tool is most appropriate for performing screening-level analysis. Users should assess the suitability for their specific applications.

In addition to observed station values for each variable, the estimated background levels (25th centile of median measurements by level 3 ecoregions (Omernik, J. M.; Griffith, G. E., 2014) were estimated for the 11 datasets.

Data and Metadata

EPA’s Freshwater Explorer 2.0 contains:

  • Estimated background conductivity: 25th centile of median monitoring data from the WQP between 2000 to 2023 by level 3 ecoregion.
  • Empirically estimated background: Monthly average of empirically modeled conductivity as it would occur if water quality was minimally influenced by anthropogenic sources (Olson and Cormier, 2019). 
  • Observed water quality parameters - WQP: Observational data from EPA’s Water Quality Portal (WQP), the nation's largest source for water quality monitoring data, cooperatively sponsored by the United States Geological Survey (USGS), the Environmental Protection Agency (EPA), and the National Water Quality Monitoring Council (NWQMC).

Applications

The most basic use of the EPA’s Freshwater Explorer is to check whether observed levels are greater than background or nearby locations. Furthermore, users can look for associations between observed water quality and land cover to begin to understand why levels may be higher than expected. From there, visualizations can vary depending on the interest of the user. For example, users may choose to compare point sources with estimated background and relationships among other water quality parameters (e.g., nutrients, chlorophyll-a), potential and actual sources (e.g., land cover and toxic release records), and demographics (e.g., population density). This combination of information can be useful for states working with communities and regulated entities to find the right balance of protection and use of freshwater resources. The background is estimated and may need to be calibrated for local conditions.

U.S. EPA Freshwater Explorer - Quick Guide

  • Freshwater Explorer 2.0 - Quick Guide
  • List of Abbreviations
  • Glossary

Background Information

What is Fresh Water?

Fresh water is characterized by the concentration of dissolved mineral ions. It is essential for drinking water, agriculture, industry, and aquatic life in streams, rivers, and inland lakes. Increases in mineral and ion levels sometimes indicate a source of pollution in freshwater systems. Higher levels of minerals like phosphorus in the water can cause harmful algal blooms and affect aquatic wildlife. These conditions can increase costs for making water suitable for drinking by people and livestock, for use in agricultural and industrial processes, and for water reuse.

Ions carry a positive or negative charge which facilitates the flow of electricity in water. The more ions, the easier electricity flows between electrodes, giving scientists a way to measure the total concentration of ions. Individual kinds of dissolved ions are usually observed with ion selective probes. Total dissolved mineral and nutrient ions are usually reported as conductivity in micro Siemens per centimeter (µS/cm) or mg/L. Within the Freshwater Explorer, conductivity refers to specific conductivity (SC) in µS/cm calibrated at 25°C. Other measurements are reported as µg/l or mg/l or standard units for pH.

Predicted Background Conductivity

Predicted monthly average background conductivity (2000-2015) as it would occur if water quality was minimally influenced by anthropogenic sources is based on geophysical and other data at thousands of sites in the United States that were judged to be relatively pristine (Olson and Cormier 2019). The predictor variables were generated for each stream line within the National Hydrography Dataset Plus version 2 (NHDPlusV2) with a random forest model that used predictor variables accessed from StreamCat Dataset (ESRI 2012, Hill et al 2016).

For more detail see the predictive background conductivity mode model metadata page.

The Natural Background Stream Conductivity Model predicts background specific conductivity (SC) for stream segments in the contiguous United States to enable comparison with measured in-stream conductivity (Olson and Cormier 2019). The predictive algorithm uses geology, soil, vegetation, climate and other empirically measured predictors. It was developed for streams with natural background SC greater than 2000 µS/cm. Above this level, inland water is considered brackish and the Natural Background Model estimates may be less reliable.

Data for some parameters that affect background SC were not readily available and were not included in the model. These include freshwater and marine interfaces, natural mineral springs, salt deposits that may affect groundwater and streams, and other natural sources of salts. In such areas the model is likely to underestimate SC. Local knowledge is necessary when assessing differences between predicted and measured background SC. The model is less precise with intermittent flows and very arid climates.

Estimated Background for Water Quality Parameters

The National Aquatic Resource Surveys (NARS) use statistical surveys with each sampling site representing a specific portion of the total resource or population of waterbodies, such as a proportion of all lakes in the nation or a subpopulation of only large lakes. Empirical background estimates in Freshwater Explorer 2.0 are the 25th centile of median values within a level 3 ecoregion of a type of waterbody, e.g., lake, stream reach, wetland, etc. (Omernik and Griffith, 2014). However, centile-based levels do not necessarily characterize natural background (Stoddard et al. 2006; Herlihy and Sifneos, 2008). Using this approach has inherent uncertainty because 25% of an ecoregion may be altered by human activity. Furthermore, as time passes, there is the potential for an upward creep of perceived ambient background, a shifting baseline (Pauly 1995; Soga and Gaston 2018). If ecosystems have degraded over time, thresholds set at fixed centiles progressively increase, contributing to a different perceived background and poorer water quality over time.

Because areal scale is also important, the estimated background in the Freshwater Explorer 2.0 uses the smallest geographical area with a sufficient sample size to support estimation. Nevertheless, localized ambient and natural background for naturally occurring substances may occur at greater or lesser levels than the regional or national norms and does not replace site recognizance or local knowledge.

Related Resources and Citations

  • EPA’s Water Quality Portal 
  • Water Quality Exchange 
  • Tools for Automated Data Analysis (TADA)
  • ESRI, 2014. ArcGIS Desktop: Release 10.2.2. Environmental Systems Research Institute, Redlands, California.
  • Hill, R.A., Weber, M.H., Leibowitz, M.H., Olsen, A.R., Thornbrugh, D.J., 2016. The Stream-Catchment (StreamCat) Dataset: A Database of Watershed Metrics for the Conterminous United States. JAWRA Journal of the American Water Resources Association, 52(1), 120-128. doi: https://doi.org/10.1111/1752-1688.12372 
  • McKay, L., Bondelid, T., Dewald, T., Johnston, J., Moore, R., Rea, A., 2012. NHDPlus Version 2: User Guide. National Operational Hydrologic Remote Sensing Center, Washington, DC. 
  • NASA, 2019. Moderate Resolution Imaging Spectroradiometer (MODIS) satellite data. Available at: https://modis.gsfc.nasa.gov/data/
  • Olson, J.R. and Cormier, S.M., 2019. Modeling spatial and temporal variation in natural background specific conductivity: Data sets and R-code. doi: https://doi.org/010.23719/1500945
  • Omernik, J. M.; Griffith, G. E., 2014. Ecoregions of the conterminous United States: evolution of a hierarchical spatial framework. Environmental. Management. 54 (6), 1249−1266. doi: https://doi.org/10.1007/s00267-014-0364-1
  • U.S. Environmental Protection Agency (U.S. EPA), 2016. STORET.  Available at: https://www.epa.gov/storet/
  • U.S. Geological Survey (USGS), 2016. National Water Information System. Available at: https://waterdata.usgs.gov/nwis
  • Cormier, S. M., 2017. Data Set for: Step-by-Step Calculation and Spreadsheet Tools for Predicting Stressor Levels that Extirpate Genera and Species. Doi: 10.23719/1371705 
  • Cormier, S.M., 2017. https://github.com/smcormier/Biological-Extirpation-Analysis-Tools-BEAT/releases/tag/v.1.0.2.
  • Soga M and Gaston KJ. 2018. Shifting baseline syndrome: causes, consequences, and implications. Front Ecol Environ 16: 222–30
  • Pauly D. 1995. Anecdotes and the shifting baseline syndrome of fisheries. Trends Ecol Evol 10: 430.
  • Stoddard, J.L., Larsen, D.P., Hawkins, C.P., Johnson, R.K. and Norris, R.H., 2006. Setting expectations for the ecological condition of streams: the concept of reference condition. Ecological applications, 16(4), pp.1267-1276. https://doi.org/10.1890/1051-0761(2006)016[1267:SEFTEC]2.0.CO;2
  • Herlihy, A.T. and J.C. Sifneos. 2008. Developing Nutrient Criteria and Classification Schemes for Wadeable Streams in the Conterminous US.  North American Benthological Society 27(4):932-948.
  • Olson, J.R. and Cormier, S.M. 2019. Modeling Spatial and Temporal Variation in Natural Background Specific Conductivity. Environmental Science & Technology. DOI: 10.1021/acs.est.8b06777. www.ncbi.nlm.nih.gov/pmc/articles/PMC7153567
  • Hill, R.A., Weber, M.H., Leibowitz, S.G., Olsen, A.R. and Thornbrugh, D.J., 2016. The Stream‐Catchment (StreamCat) Dataset: A database of watershed metrics for the conterminous United States. JAWRA Journal of the American Water Resources Association, 52(1), pp.120-128.

Water Research

  • Watersheds Research
    • Watershed Assessment Research
    • Ecosystem and Community Resilience Research
    • Advanced Ambient Water Quality Research
  • Nutrients and Harmful Algal Blooms Research
    • Nutrients Research
    • Harmful Algal Blooms Research
  • Water Treatment and Infrastructure Research
    • Drinking Water Research
      • Treatment and Control of Contaminants
      • Infrastructure Resilience and Sustainability
      • Source Water Quality
      • Exposure and Health Risks
      • Models, Tools, and Analytical Methods
      • Technical Assistance in Support of BIL
      • Training, Outreach, and Technical Support
    • PFAS Research
      • PFAS Analytical Methods Research
    • Alternative Water Sources Research
    • Stormwater Management Research
    • Wastewater Research
  • Water Research Grants
  • Research Outputs
  • Training, Outreach, and Technical Support
    • Harmful Algal Blooms, Hypoxia, and Nutrients Research Webinars
    • Small Drinking Water Systems Webinars
    • Water Research Webinars
Contact Us about Water Research
Contact Us to ask a question, provide feedback, or report a problem.
Last updated on May 1, 2025
  • Assistance
  • Spanish
  • Arabic
  • Chinese (simplified)
  • Chinese (traditional)
  • French
  • Haitian Creole
  • Korean
  • Portuguese
  • Russian
  • Tagalog
  • Vietnamese
United States Environmental Protection Agency

Discover.

  • Accessibility Statement
  • Budget & Performance
  • Contracting
  • EPA www Web Snapshot
  • Grants
  • No FEAR Act Data
  • Plain Writing
  • Privacy
  • Privacy and Security Notice

Connect.

  • Data
  • Inspector General
  • Jobs
  • Newsroom
  • Regulations.gov
  • Subscribe
  • USA.gov
  • White House

Ask.

  • Contact EPA
  • EPA Disclaimers
  • Hotlines
  • FOIA Requests
  • Frequent Questions
  • Site Feedback

Follow.