
Red Hill Groundwater Results Application
Background
EPA is pleased to present an application developed to provide you with a simple way to view up-to date information about groundwater quality around the Red Hill Bulk Fuel Storage Facility in Hawaiʻi. The application combines multiple historical and current data sets that the Navy has made available online. By combining the data and displaying it in maps, graphs, and tables, the application makes it easier to understand information that is currently provided as individual reports.
The application also lets you filter the sampling results by a variety of features, including the analytes sampled, the dates of the sampling events, the well names, and screening levels. The filters are dynamic, so as you select information using one filter, the application changes the options available in other filters. The map, graph, and table are also filtered to show only the information you want to see. The graph shows how the concentrations of the selected analytes changed over time. The table can be downloaded so you can see additional details or use the data in your own reports.
EPA regularly pulls laboratory results directly from the Navy’s Electronic Data Management System into the application, so the groundwater sample results will be kept current and relevant. This will allow you to view the latest validated Red Hill Bulk Fuel Storage Facility sampling data and compare current groundwater sample results to results collected during previous groundwater sampling events. As of the application's publication date, data has been imported every Sunday. This frequency may change as the project progresses.
Instructions
The Red Hill Groundwater Results application has five main parts. When you first open the dashboard, you’ll see four features – a map on the left, a filter bar at the top, a white “Concentrations Over Time” square to the right, and a table and instructional tabs at the bottom.
As you use the dashboard, you’ll notice tools that are available when you use the map, graph, and/or table:
- At the upper right-hand corner, you’ll see a circle with arrows in it. Click this button to open the map, graph, or table to full screen. Click it again to minimize it and see the full dashboard.
- At the lower right-hand corner, you’ll see a larger blue circle with a counterclockwise round arrow. Click this to refresh or remove the filters from the application.
Map
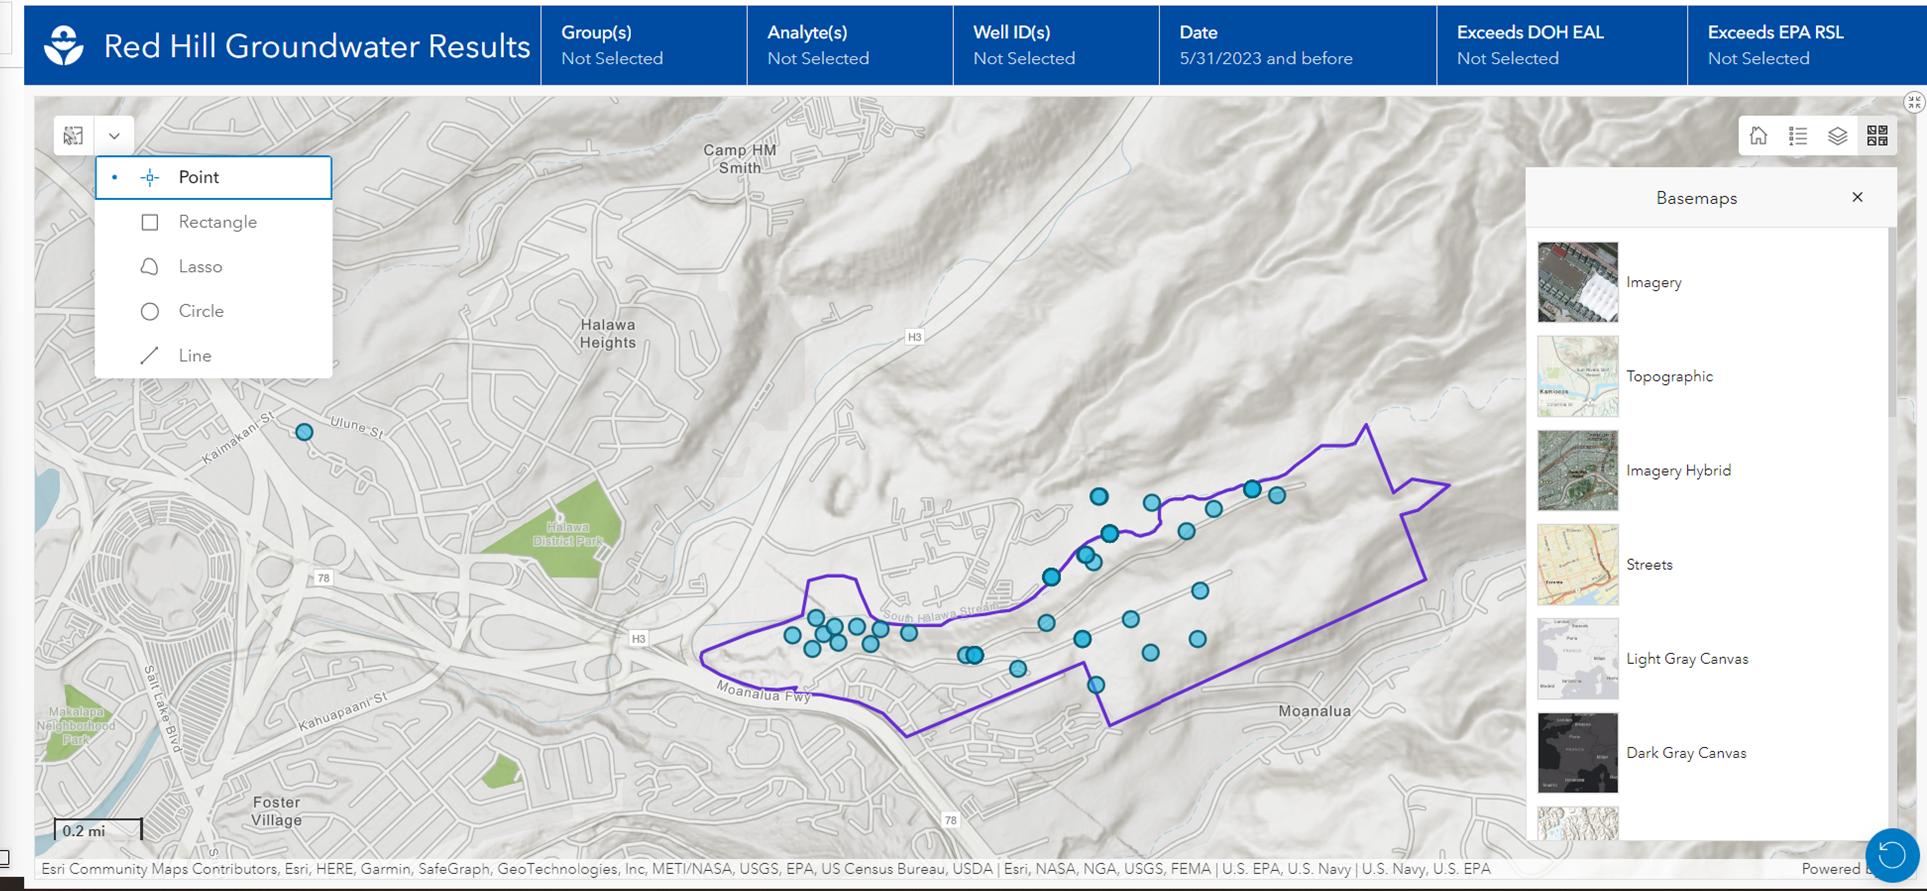
As with any map, you can “click and pull” to pan, “Ctrl+” or “Ctrl-” to zoom in and out. Other basic features like the option to return to “home zoom”, select a basemap, or view the legend are available in a menu at the upper right. A menu at the upper left allows you to use drawing tools on your map.
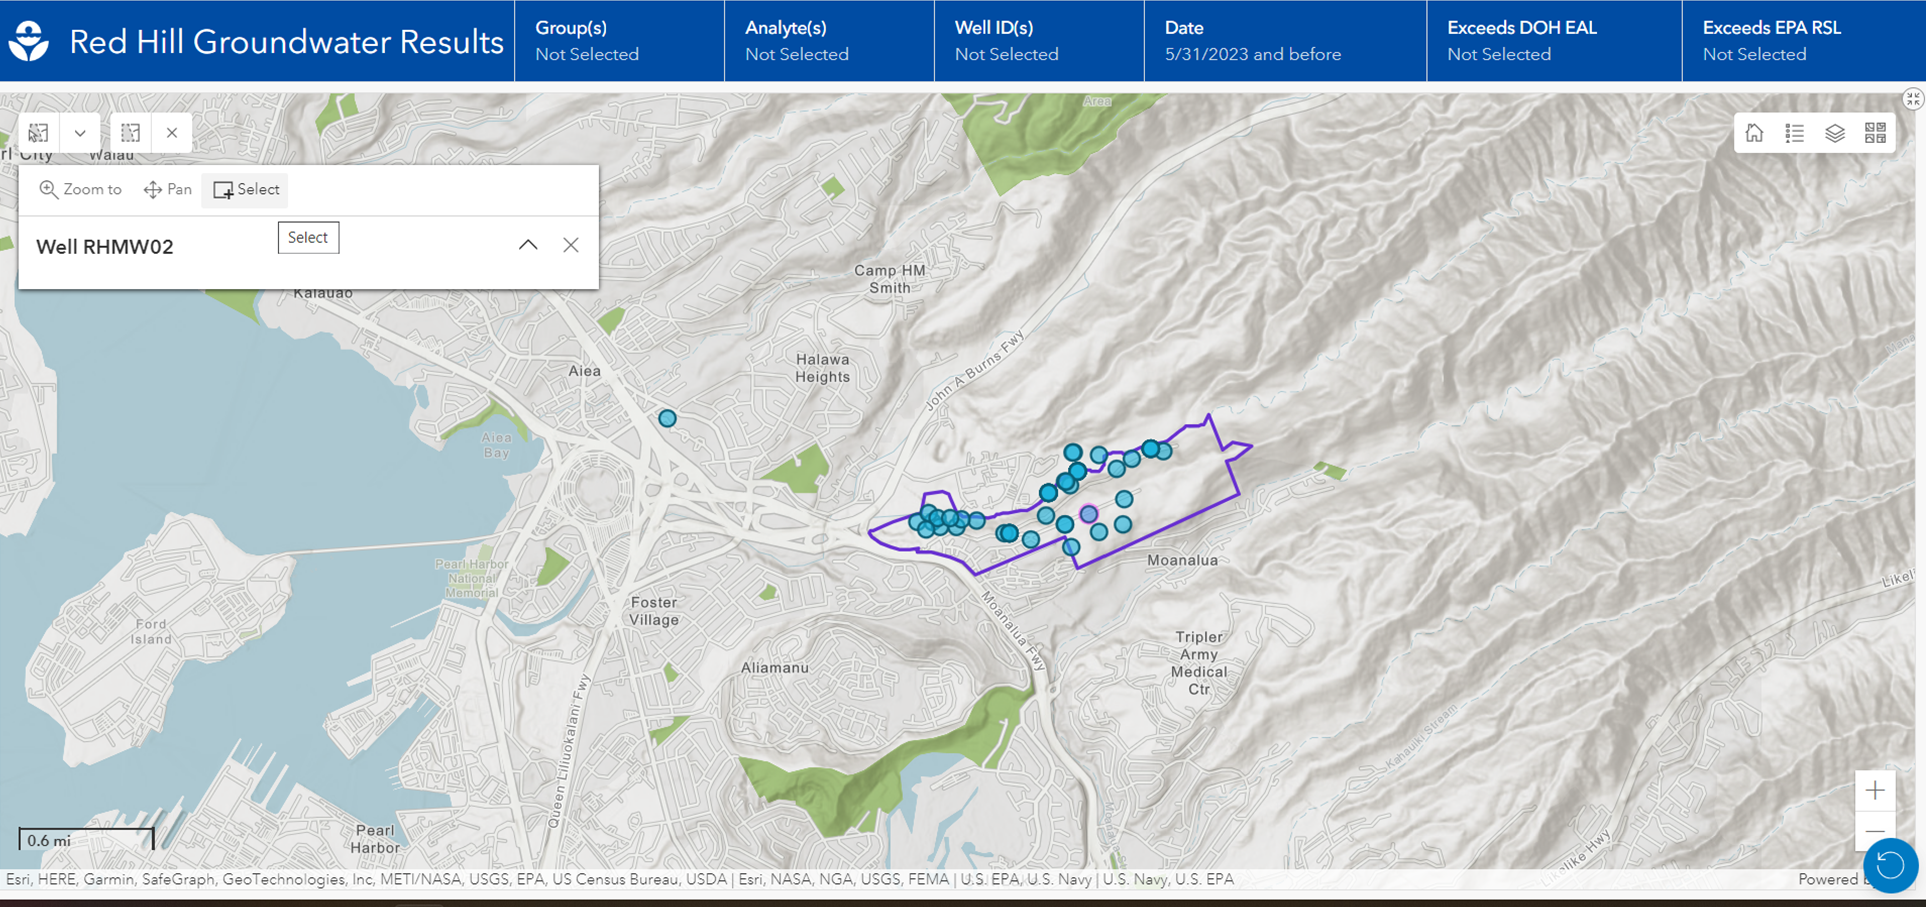
You can also click on any well (blue point feature) and a new menu will pop up. Click “Select” to view all the sample results for that well on the table.
Pro tip: Select well in map, then use filter bar at top to filter for an analyte or analytes of interest (even “select all”. This will render a graph of the selected analytes for your selected well.)
Filters
The dashboard includes several iterative filters that you can access on the top menu bar. The order that you select the filters affects how they work. The graph, map, and tables will change based which filters you select and in which order you choose your filters. Available filters and how you might use them are described below:
- Analyte Group(s) – If you are interested in seeing all analytes of a particular category (Per-and polyfluoroalkyl substances [PFAS], for instance), select the category/categories you are interested in, then move to the next filter button (“Analyte(s)”).
- Analyte(s)
- If an analyte group or analyte groups was/were selected in the previous filter, this analyte filter will only show the chemicals associated with those groups. Click the “Analyte(s) button. Then select which analytes you are interested in.
- If you choose not to select an analyte group on the previous filter, when you click the “Analyte(s)” button all analytes are visible on the “Analyte(s)” button. Select which you are interested in, or “Select All” at the bottom.
- Well ID(s) – You can use this tab two ways:
- If you selected an analyte or analytes on the previous menu buttons, the “Well ID(s)” button will only show the wells where all the analytes you selected were detected.
- If you do not select and analyte or analytes before choosing a well or wells you are interested in, the table will populate with all results for all your selected wells, and the map will show only that/those well location(s)
- Date – As with the other menu buttons, please feel free to use the date filter before or after you make other filter selections.
- You can narrow the date range first, then search for specific screening level exceedances, analytes, and/or well IDs with data within that date range.
- Conversely, you can look for all the analytes, wells, and/or screening level exceedance you are interested in, and then use the date filter to focus on a certain time period.
- Exceeds DOH EAL/Exceeds EPA RSL - As with the other menu buttons, please feel free to use the Exceeds DOH EAL and/or the Exceeds EPA RSL filter(s) before or after you make other filter selections. For chemicals that exceed both DOH EALs and EPA RSLs, select “yes” on both filter buttons.