
USGS Background Soil-Lead Survey: State Data
National Interactive Map (Choose your State to Begin)
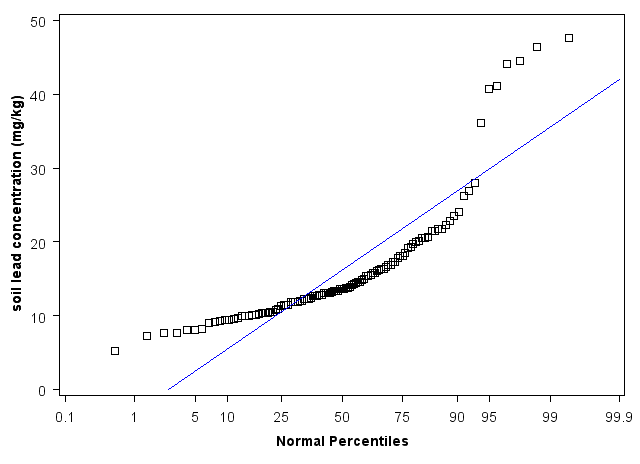
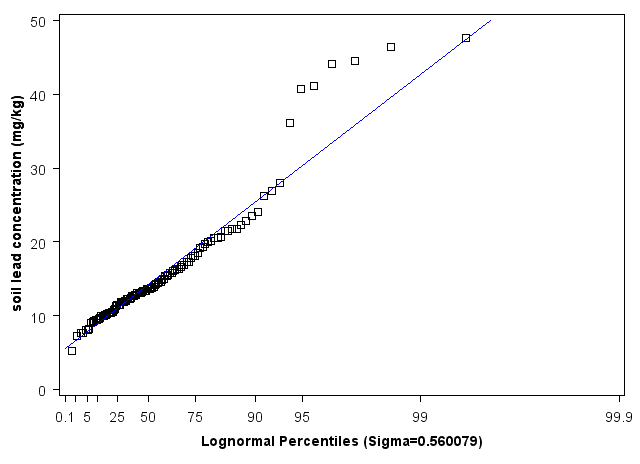
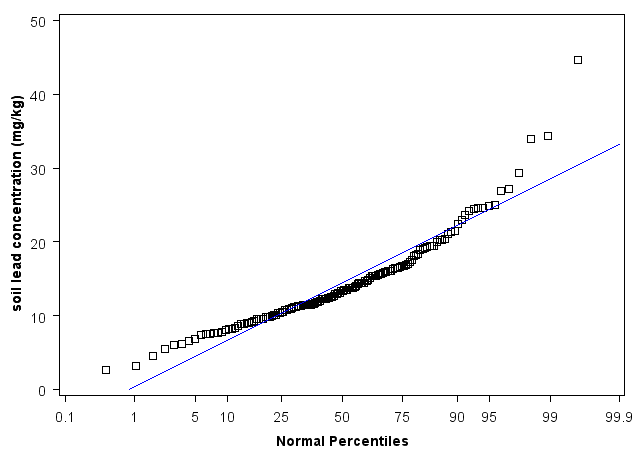
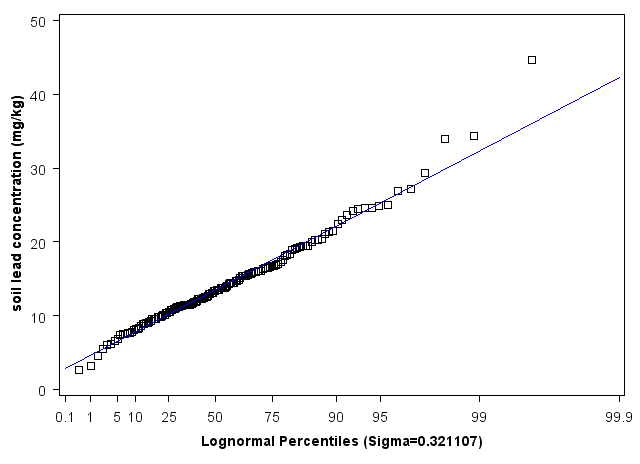
Overview
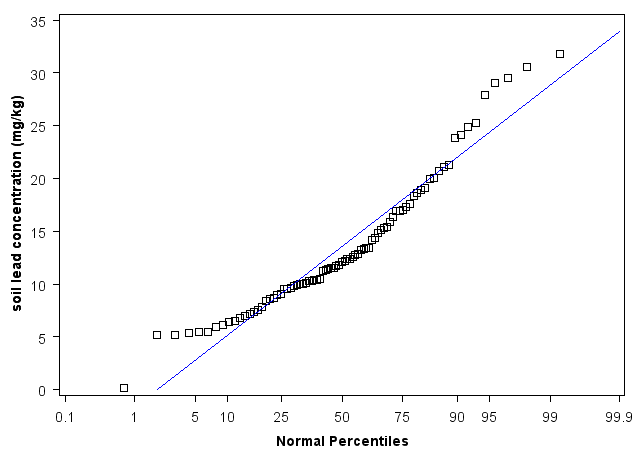
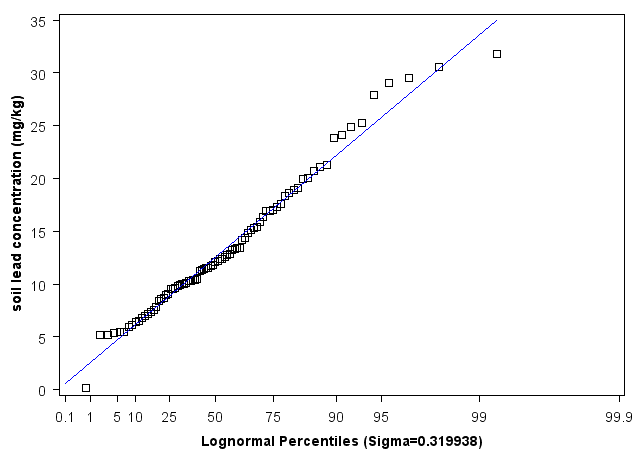
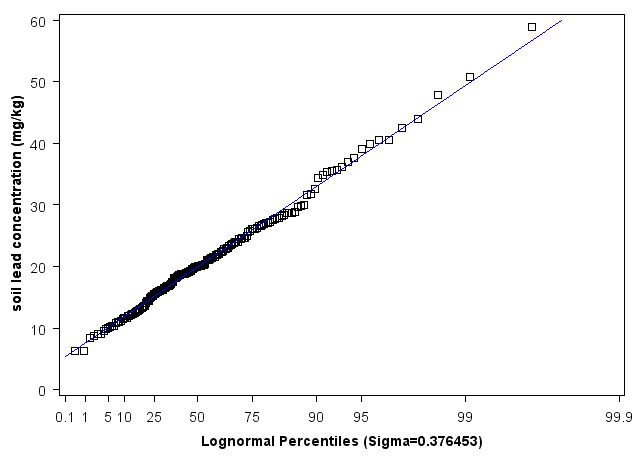
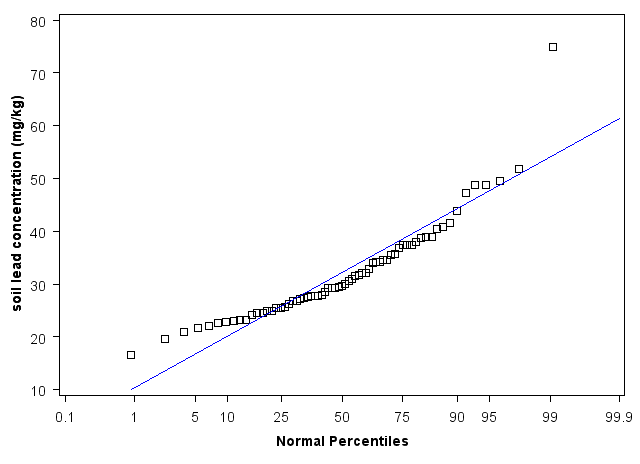
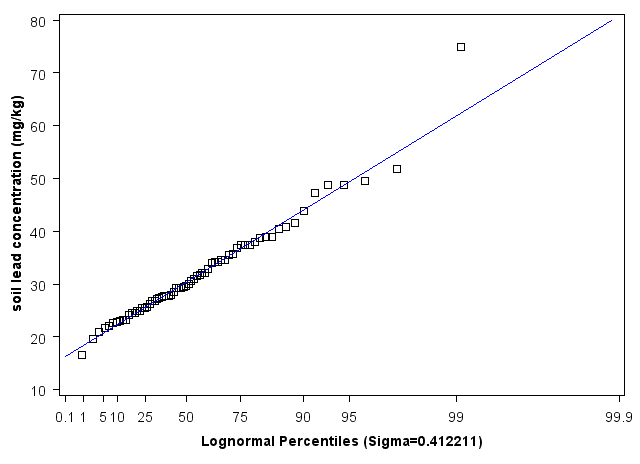
Potential statistical 'outliers' were determined separately for each state. Specifically, outliers are defined here as soil lead results that are two and three standard deviations greater than the average. Spatial outliers were defined using Anselin's Local Moran's I statistic to identify observations that were statistically significantly different from other nearby observations.1 The spatial outliers include observations that are surrounded by observations with significantly lower concentrations. The definition of spatial outlier used here also includes local clusters of two or more observations with significantly higher concentrations than surrounding observations.
It is important to note that labeling an observation as an 'outlier' does not imply there is something necessarily 'wrong' with the observation; e.g., outliers should not automatically be omitted from an analysis or discarded as invalid. The method for handling outliers varies depending on the objectives of the analysis. Furthermore, there are many ways to define outliers; the definition that is used should support the objective of the analysis. The objective of this web site is to simply describe the data. The effect of the outliers on summary statistics of the data is illustrated by comparing the statistics in the tables provided below. The user is encouraged to download the data for further exploration and analysis, including a determination of which observations should be considered outliers, given the objectives of their analysis.
1 Anselin, 1995. Local Indicators of Spatial Association-LISA. Geographical Analysis, 27(2). April. 93-115 (PDF)(23 pp, 1.5 MB)
Alabama State Data
Tables
Geogenic Soil Lead Concentrations (mg/kg): 2007-2010 (All Data)
| Number of Samples |
Mean |
Std Error |
95 UCL |
Std Dev |
Coeff of Variation |
Min |
Q1 |
Median |
Q3 |
90th |
95th |
99th |
Max |
|---|---|---|---|---|---|---|---|---|---|---|---|---|---|
| 85 | 14.2 | 0.8 | 15.6 | 7.6 | 0.534 | 0.3 | 9.6 | 12.2 | 17.4 | 24.9 | 29.6 | 39.3 | 39.3 |
Geogenic Soil Lead Concentrations (mg/kg): 2007-2010 (Outliers Excluded)
| Number of Samples |
Mean |
Std Error |
95 UCL |
Std Dev |
Coeff of Variation |
Min |
Q1 |
Median |
Q3 |
90th |
95th |
99th |
Max |
|---|---|---|---|---|---|---|---|---|---|---|---|---|---|
| 83 | 13.6 | 0.7 | 14.8 | 6.6 | 0.484 | 0.3 | 9.1 | 12.1 | 17.1 | 23.9 | 28.0 | 31.8 | 31.8 |
About These Tables:
These tables show the overall occurrence of lead in surface samples as described by USGS.
Sources of These Data:
The U.S. Geological Survey provided the soil sampling data. The data display was prepared by U.S. Environmental Protection Agency. Revision Date:
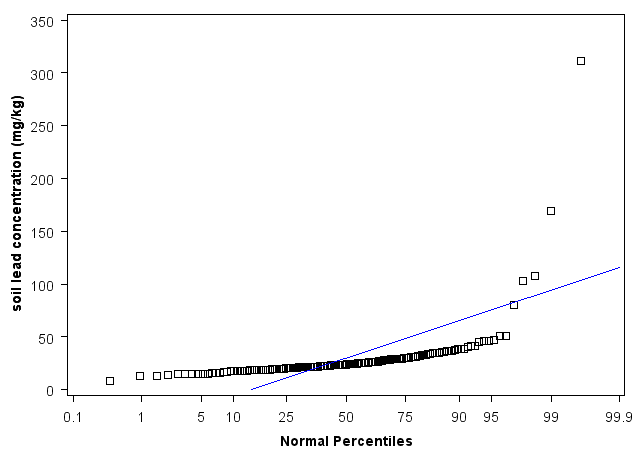
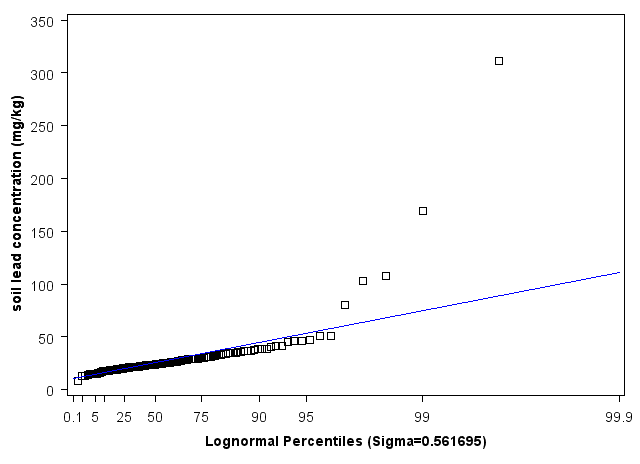
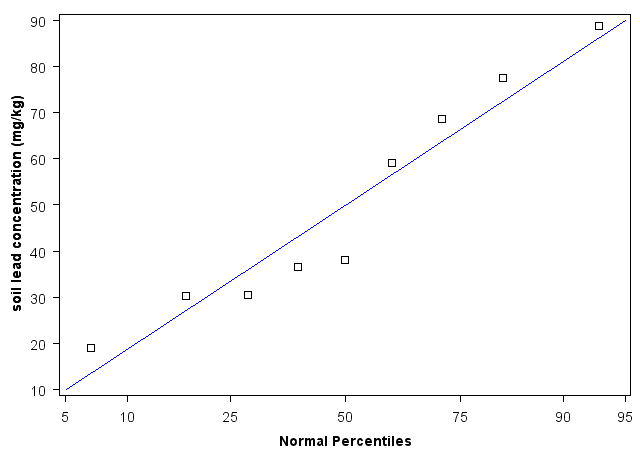
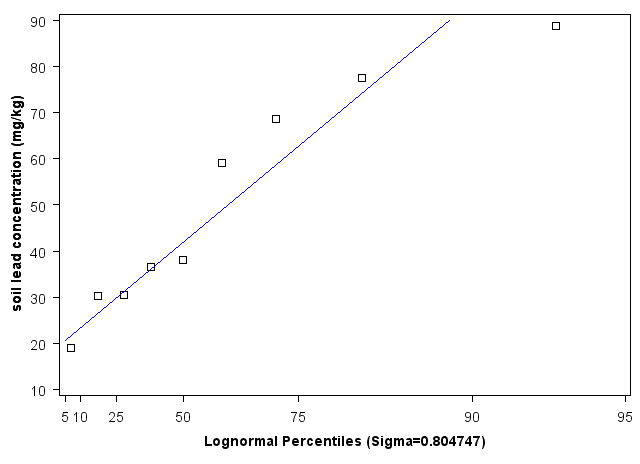
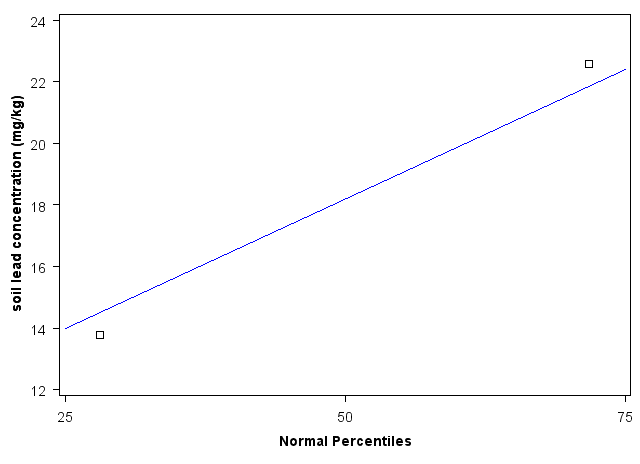
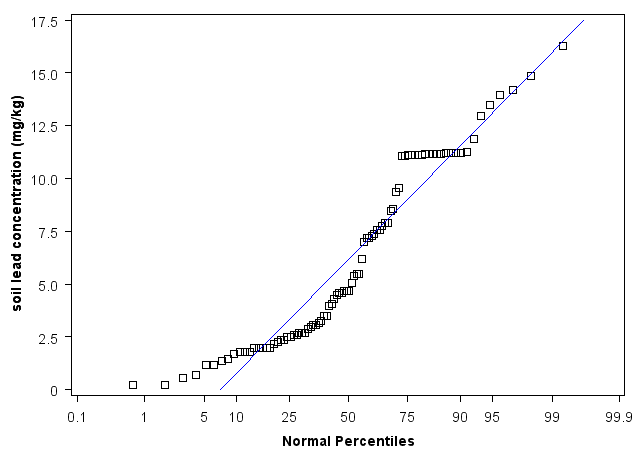
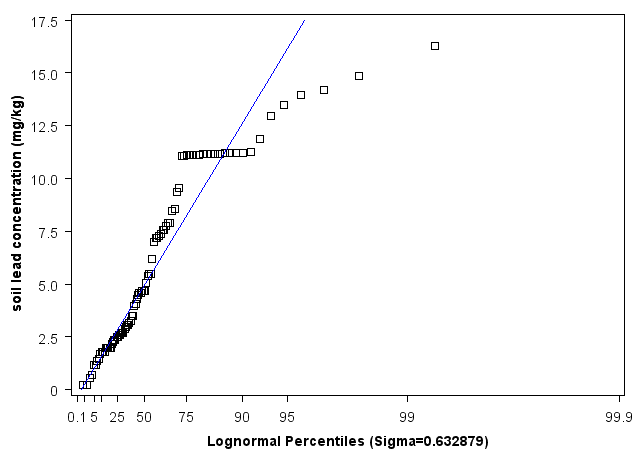
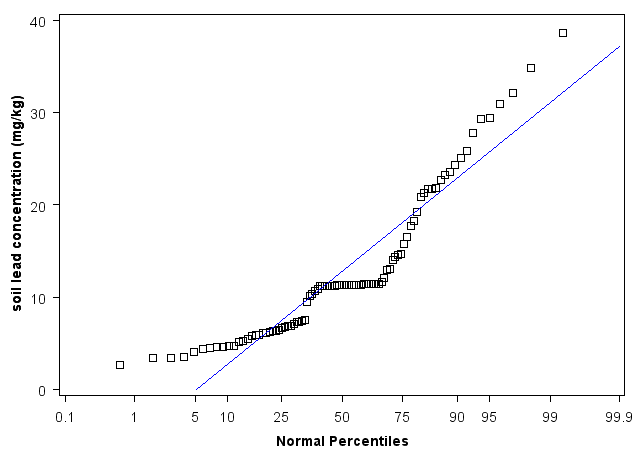
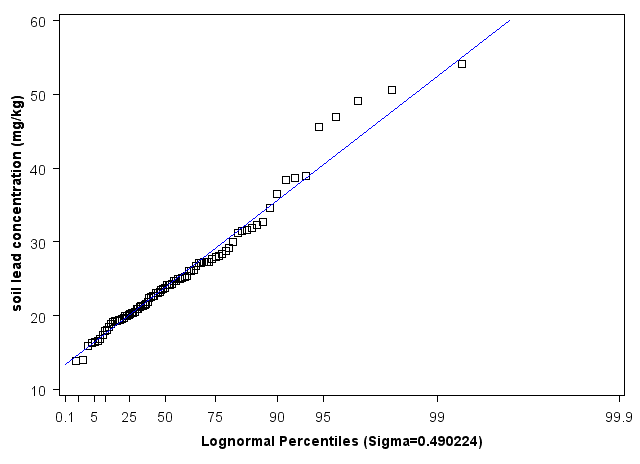
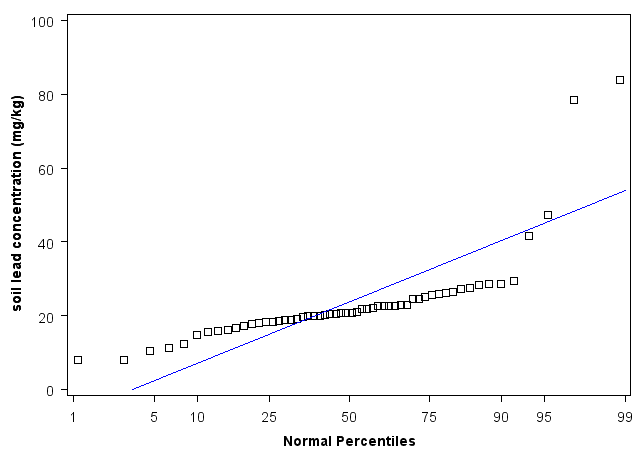
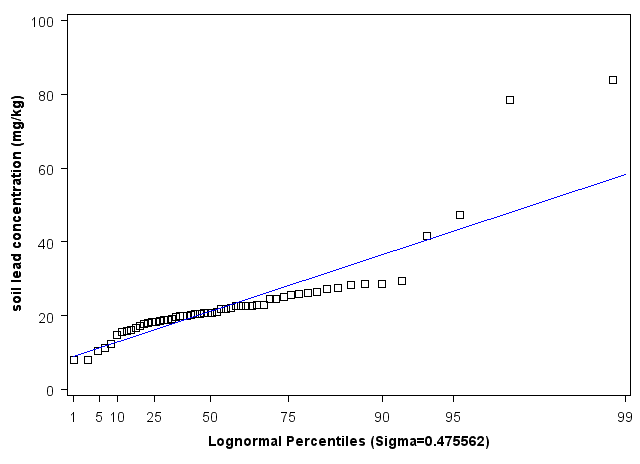
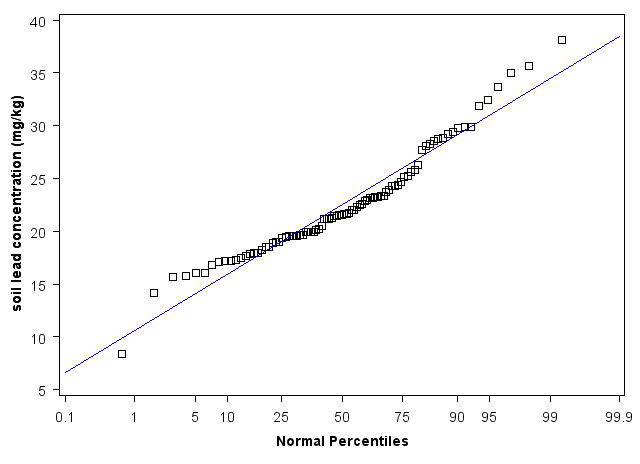
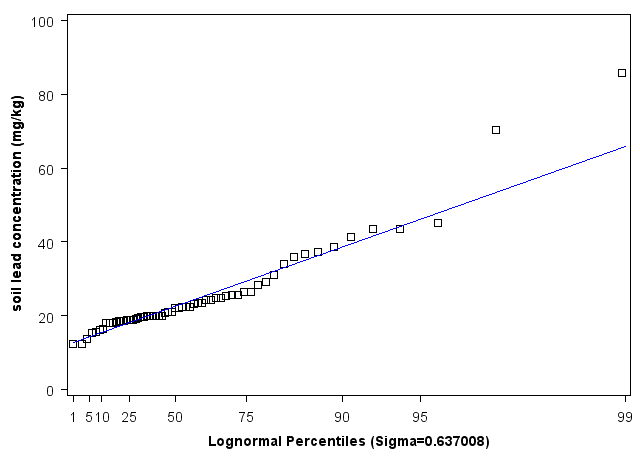
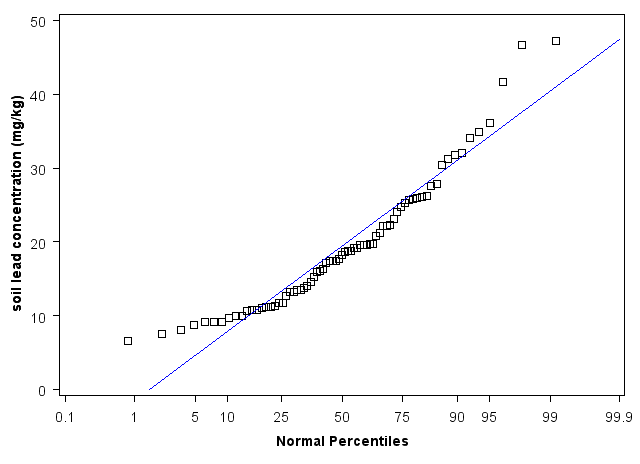
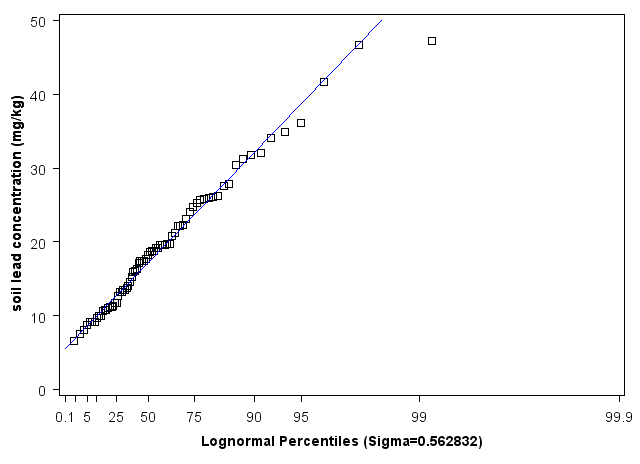
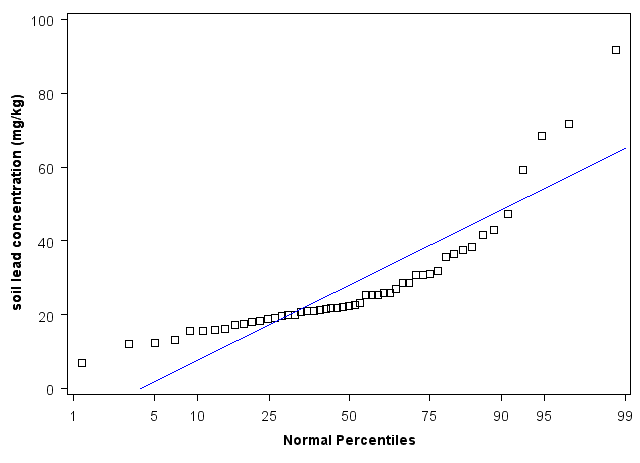
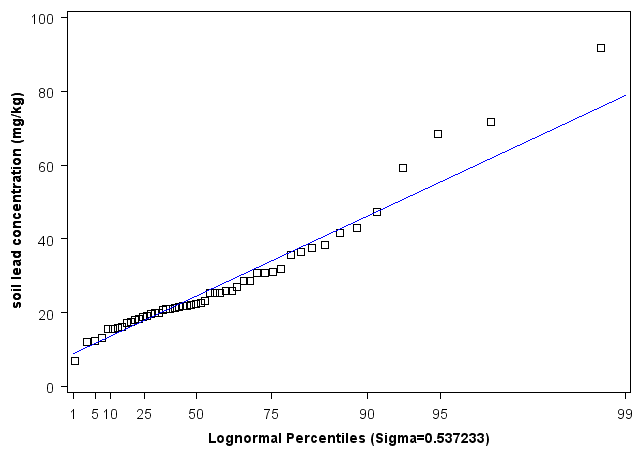
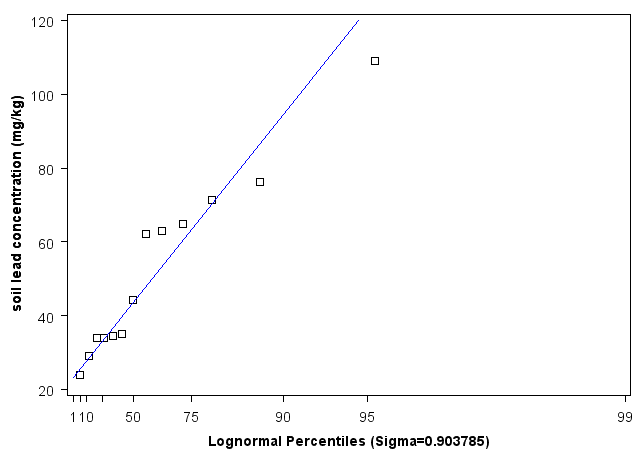
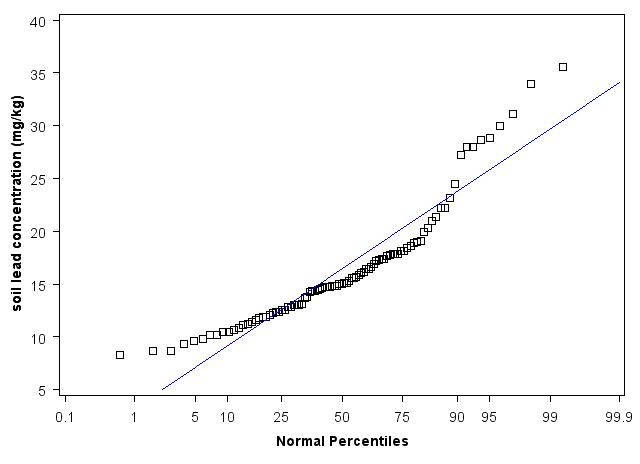
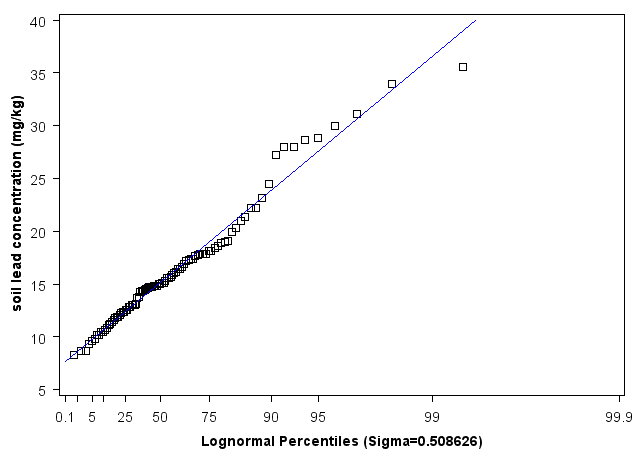
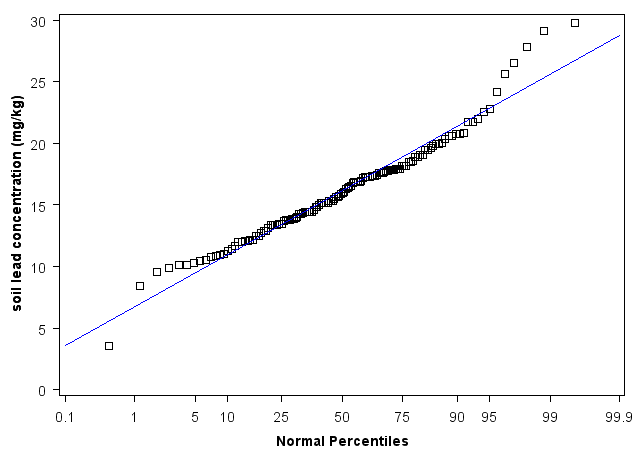
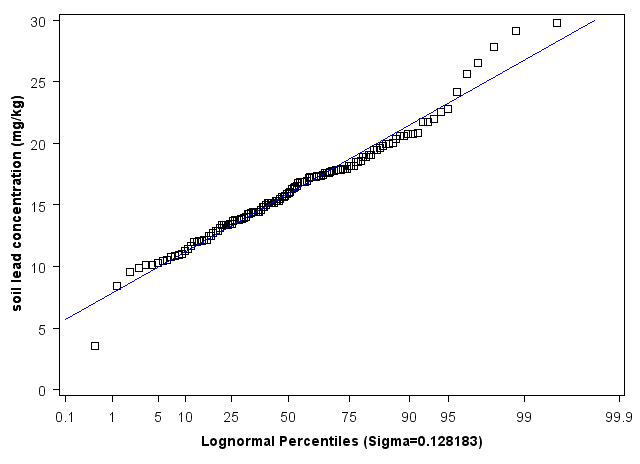
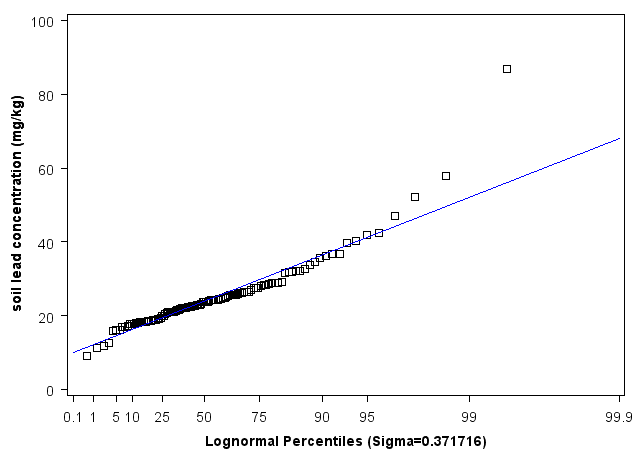
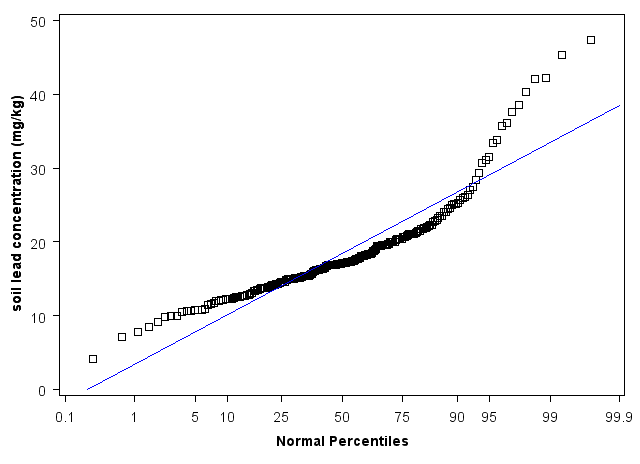
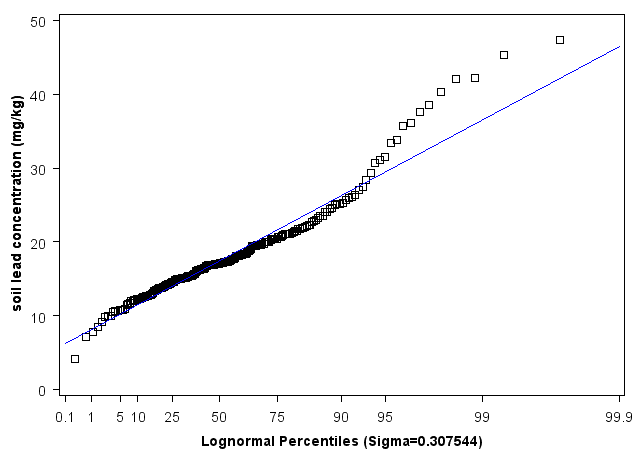
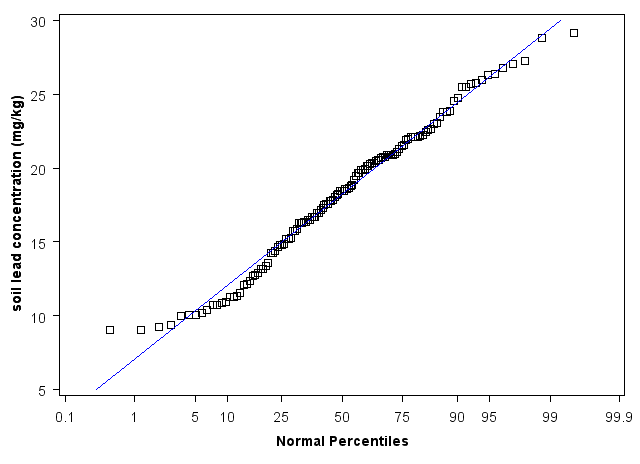
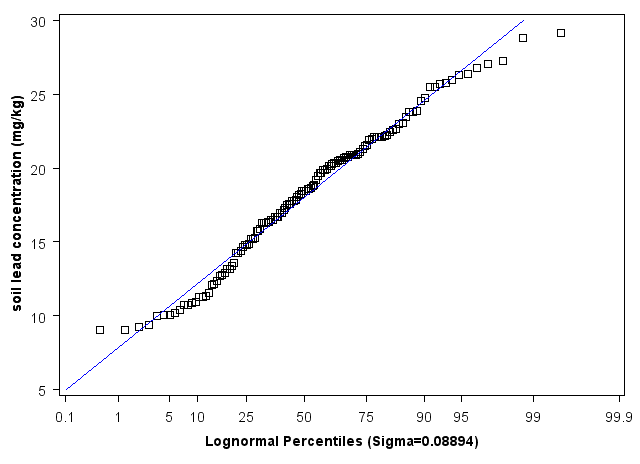
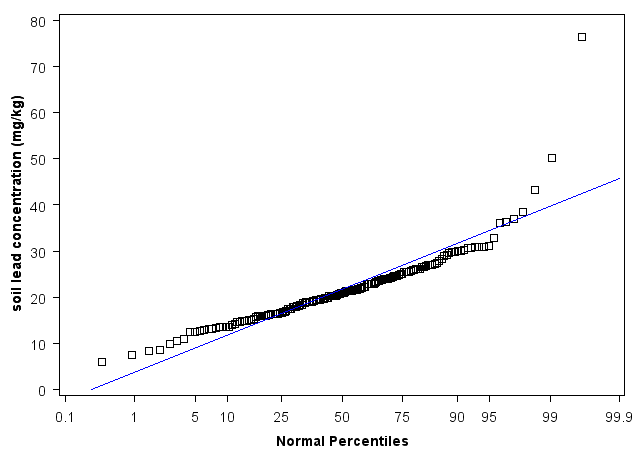
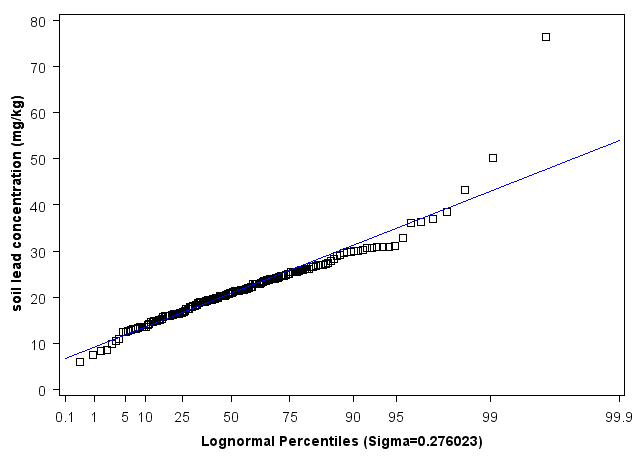
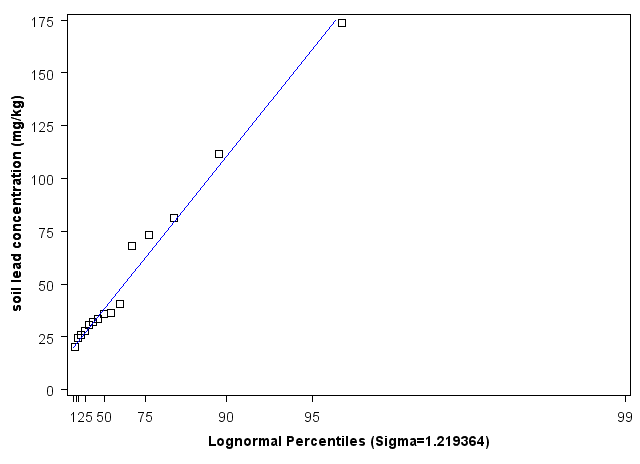
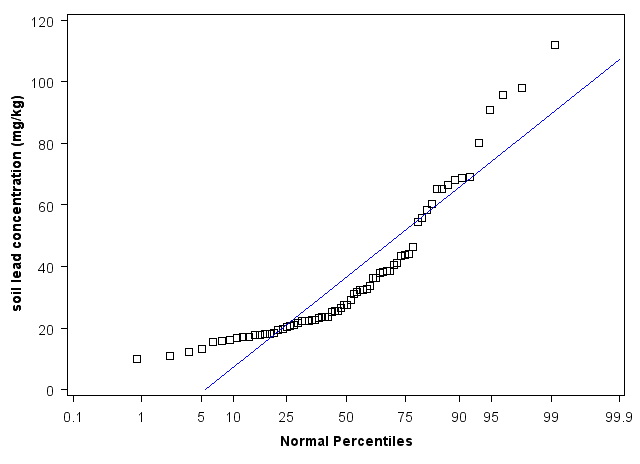
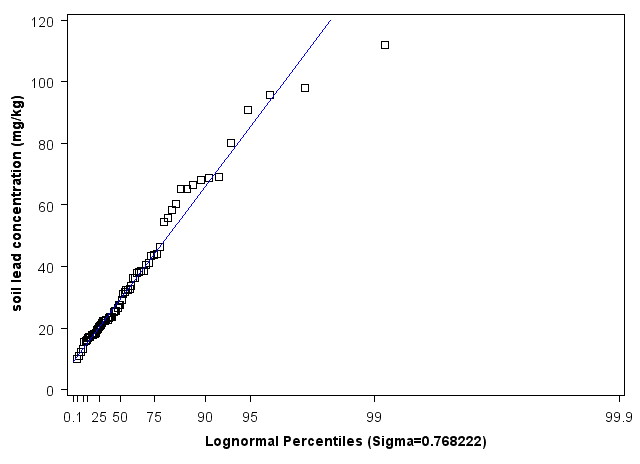
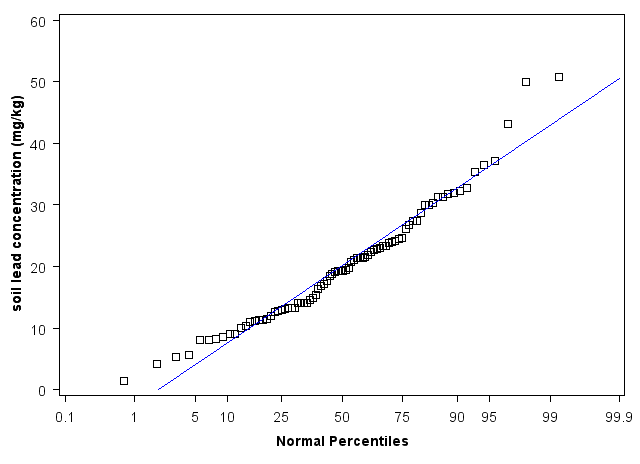
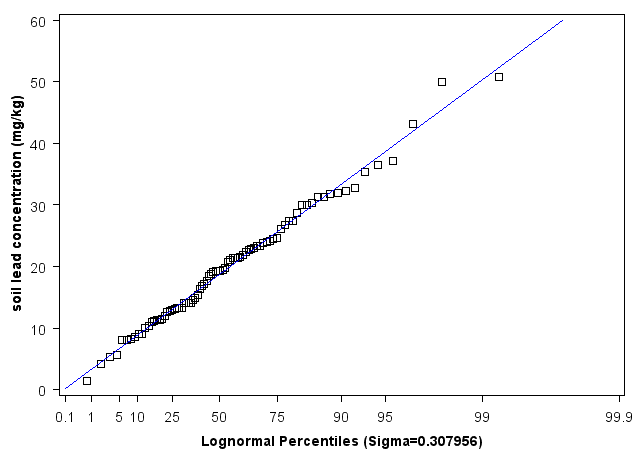
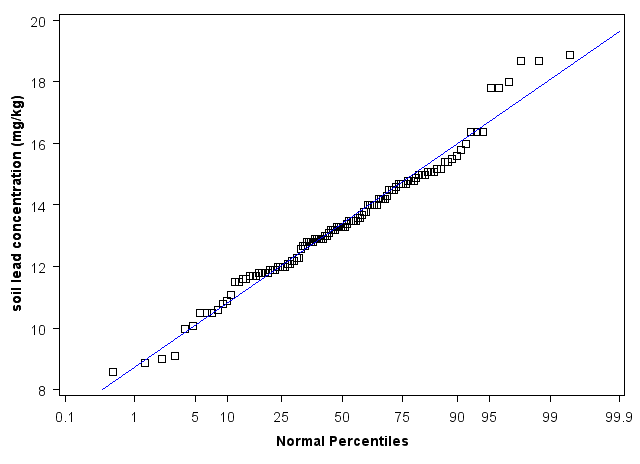
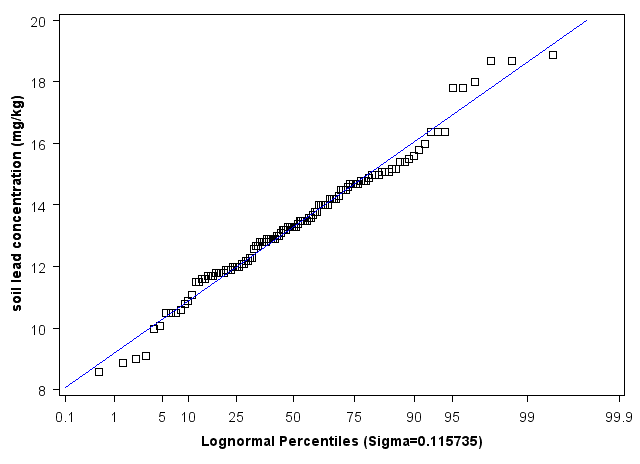
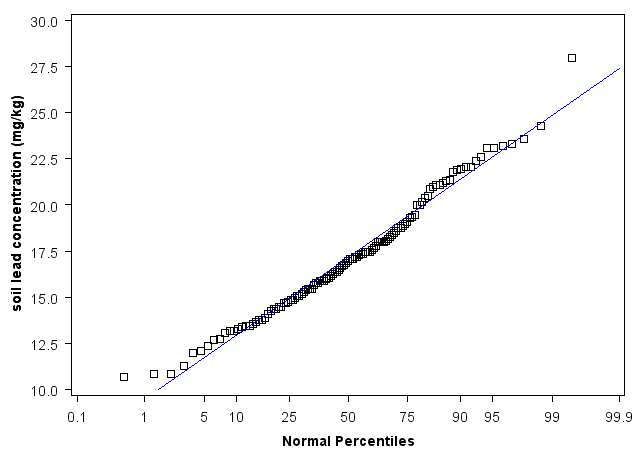
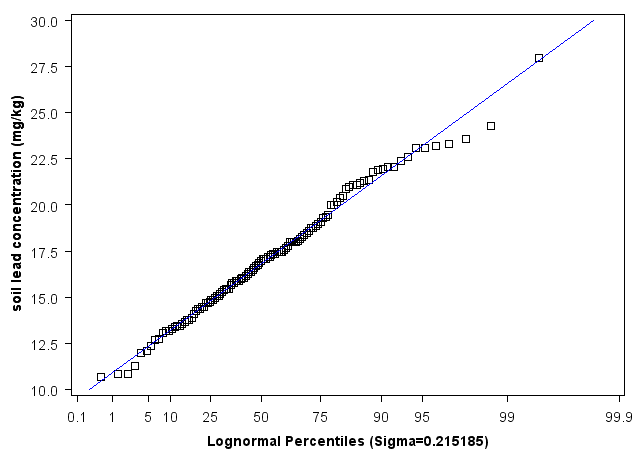
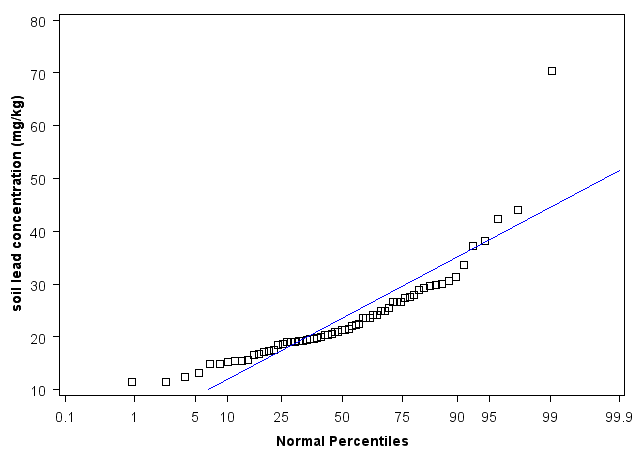
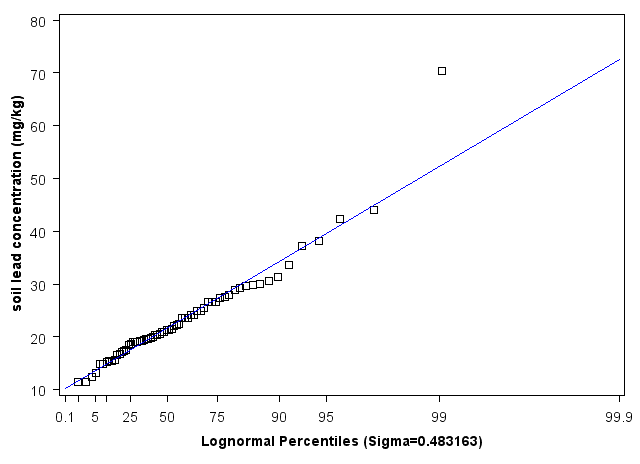
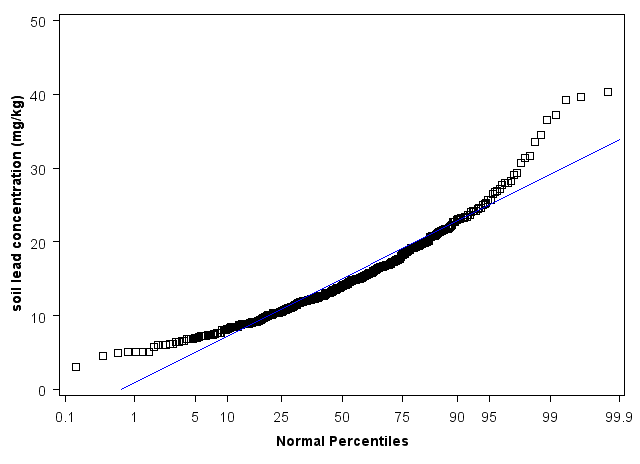
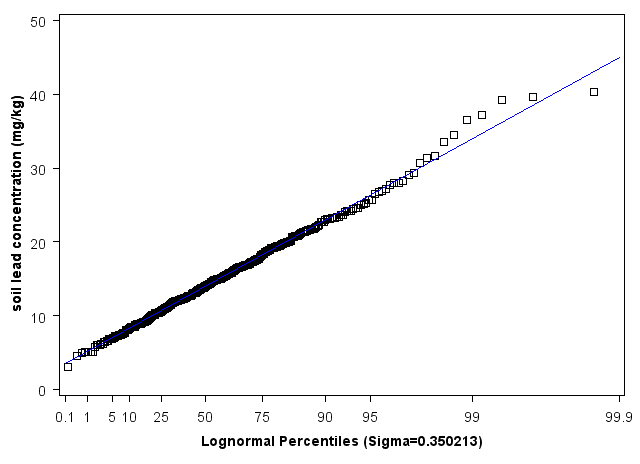
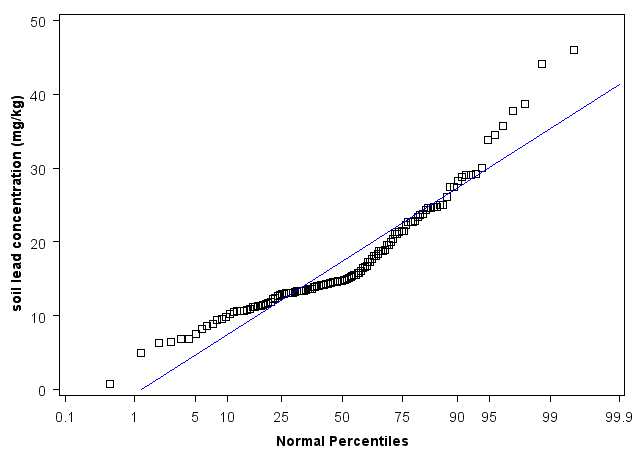
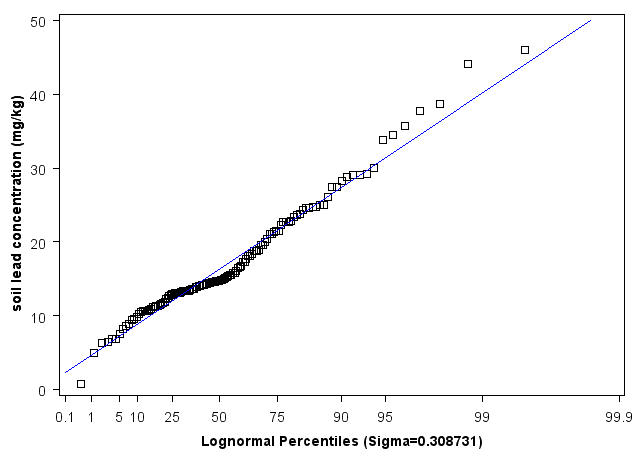
Charts
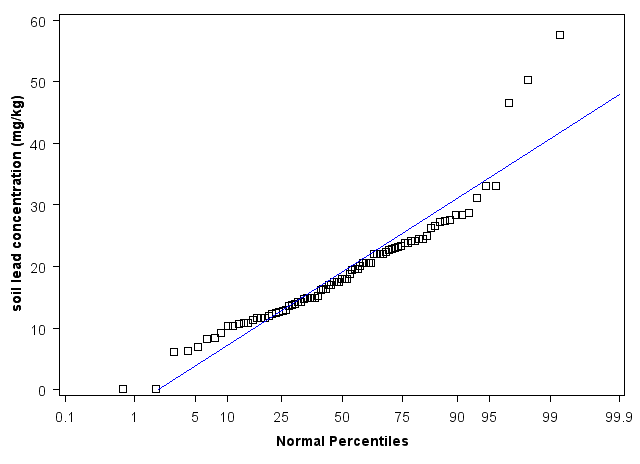
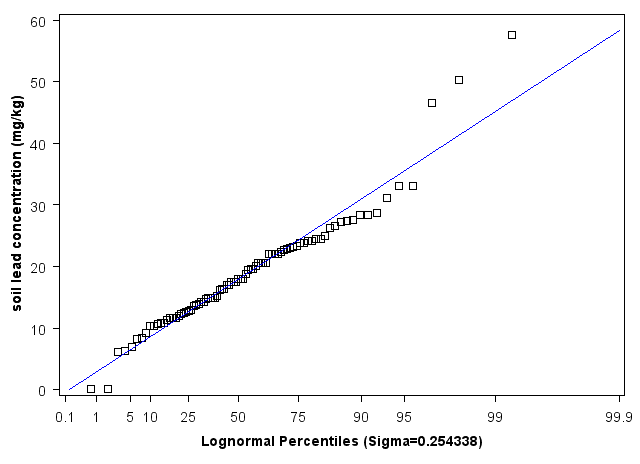
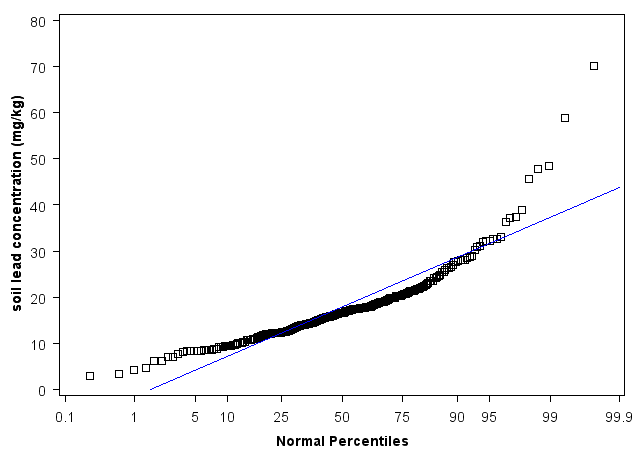
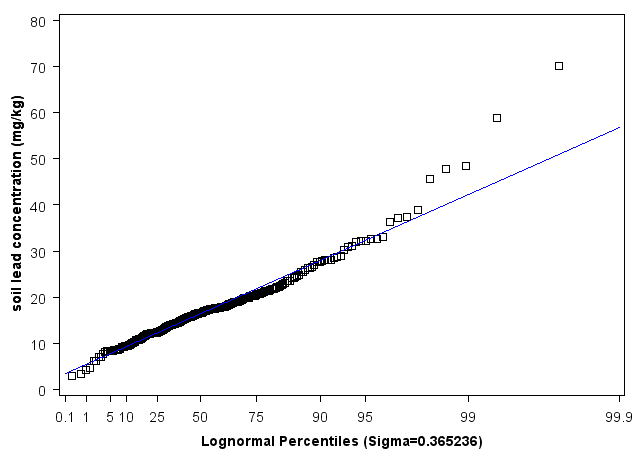
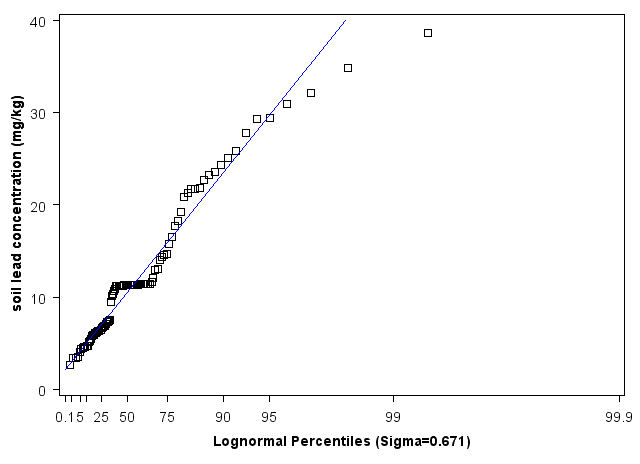
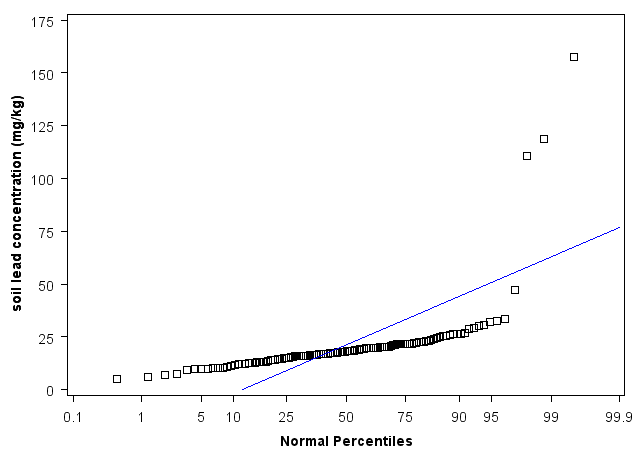
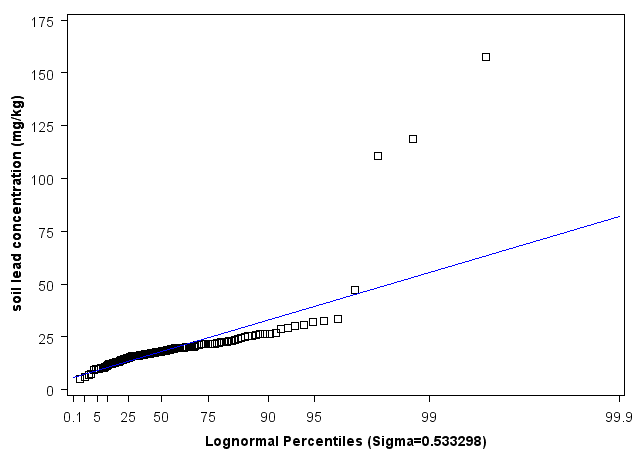
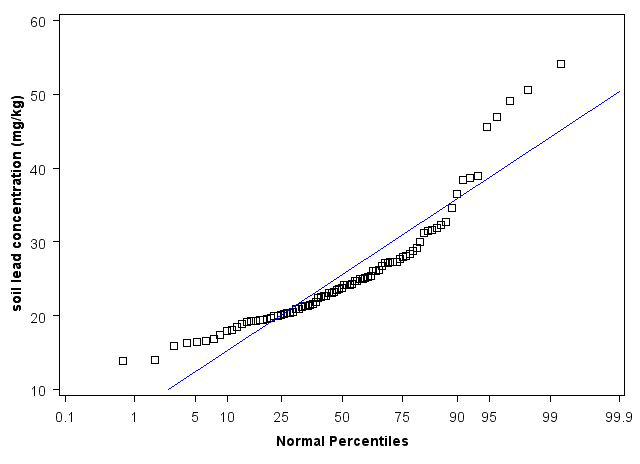
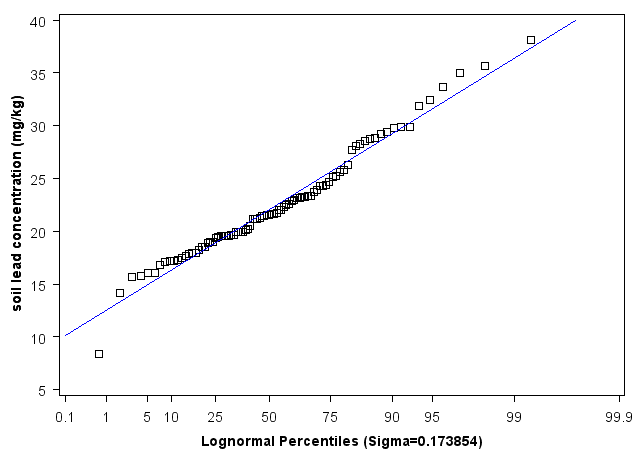
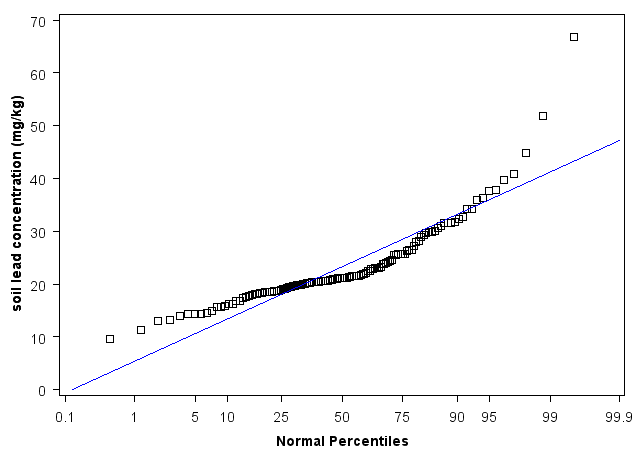
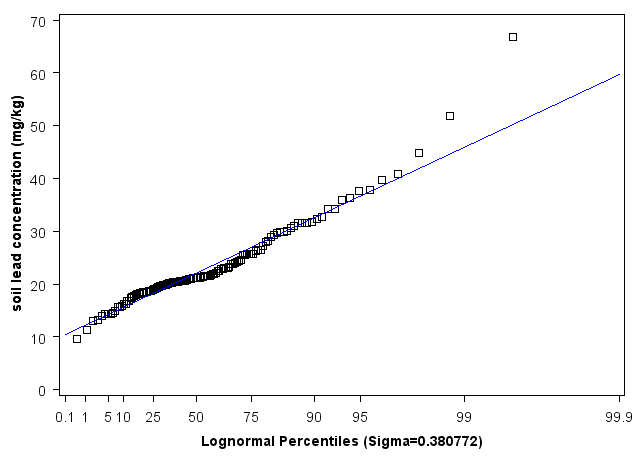
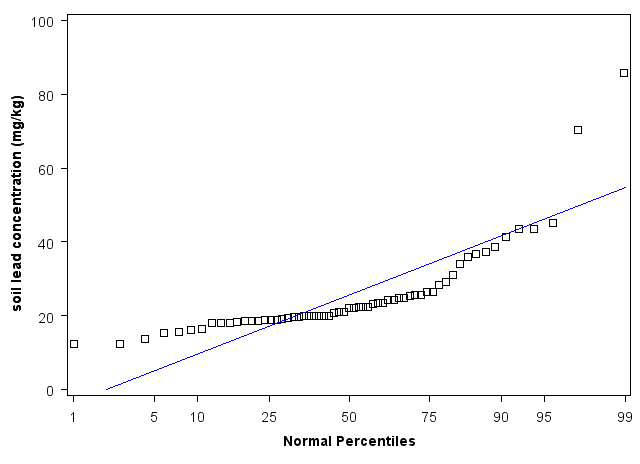
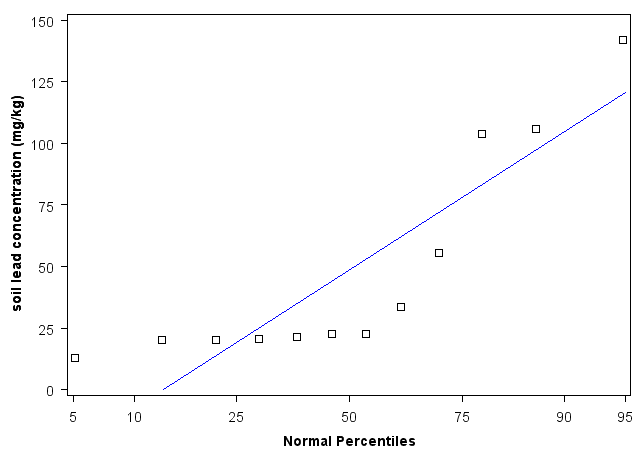
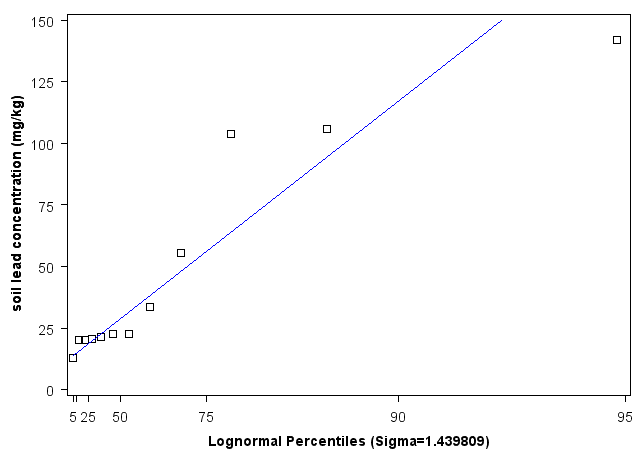
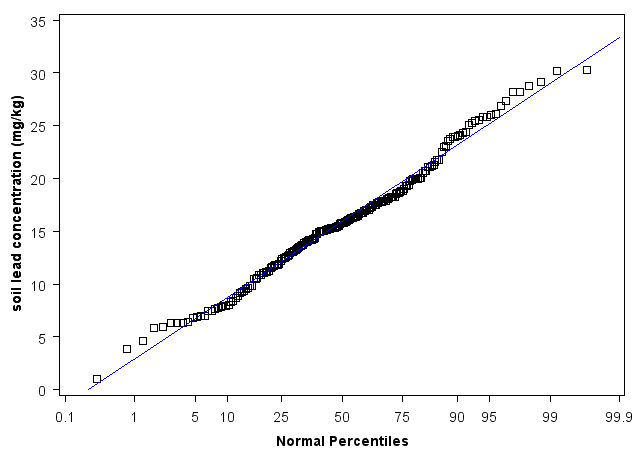
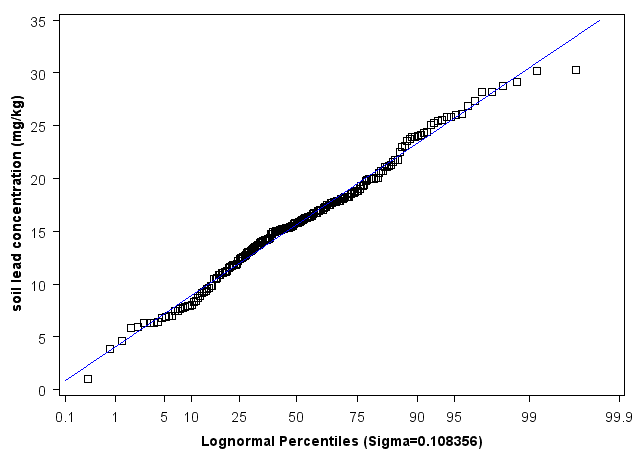
About These Charts:
These charts show the overall occurrence of lead in surface samples as described by USGS.
Sources of These Data:
The U.S. Geological Survey provided the soil sampling data. The data display was prepared by U.S. Environmental Protection Agency. Revision Date:
Arizona State Data
Tables
Geogenic Soil Lead Concentrations (mg/kg): 2007-2010 (All Data)
| Number of Samples |
Mean |
Std Error |
95 UCL |
Std Dev |
Coeff of Variation |
Min |
Q1 |
Median |
Q3 |
90th |
95th |
99th |
Max |
|---|---|---|---|---|---|---|---|---|---|---|---|---|---|
| 177 | 23.7 | 1.3 | 25.9 | 17.9 | 0.753 | 6.3 | 15.7 | 20.1 | 26.3 | 35.6 | 42.5 | 123.0 | 161.0 |
Geogenic Soil Lead Concentrations (mg/kg): 2007-2010 (Outliers Excluded)
| Number of Samples |
Mean |
Std Error |
95 UCL |
Std Dev |
Coeff of Variation |
Min |
Q1 |
Median |
Q3 |
90th |
95th |
99th |
Max |
|---|---|---|---|---|---|---|---|---|---|---|---|---|---|
| 173 | 21.4 | 0.7 | 22.5 | 8.8 | 0.411 | 6.3 | 15.6 | 20.0 | 26.1 | 32.7 | 39.2 | 50.8 | 59.0 |
About These Tables:
These tables show the overall occurrence of lead in surface samples as described by USGS.
Sources of These Data:
The U.S. Geological Survey provided the soil sampling data. The data display was prepared by U.S. Environmental Protection Agency. Revision Date:
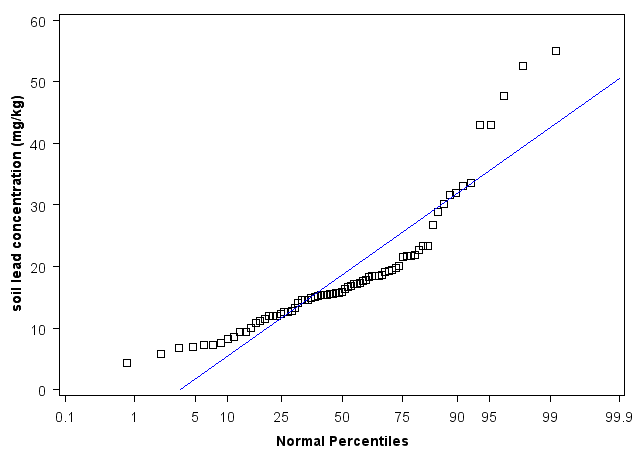
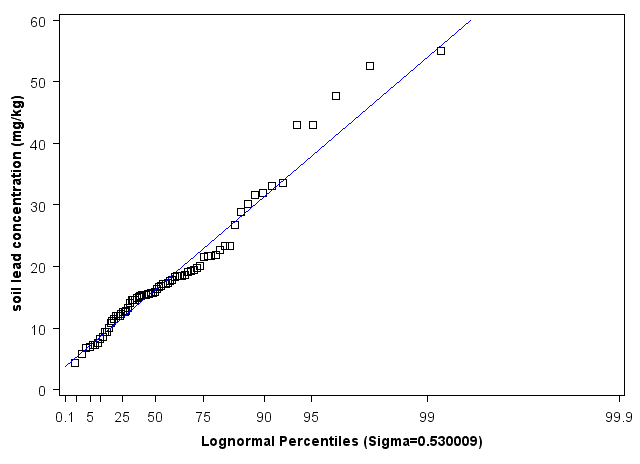
Charts

About These Charts:
These charts show the overall occurrence of lead in surface samples as described by USGS.
Sources of These Data:
The U.S. Geological Survey provided the soil sampling data. The data display was prepared by U.S. Environmental Protection Agency. Revision Date:
Arkansas State Data
Tables
Geogenic Soil Lead Concentrations (mg/kg): 2007-2010 (All Data)
| Number of Samples |
Mean |
Std Error |
95 UCL |
Std Dev |
Coeff of Variation |
Min |
Q1 |
Median |
Q3 |
90th |
95th |
99th |
Max |
|---|---|---|---|---|---|---|---|---|---|---|---|---|---|
| 87 | 20.7 | 1.5 | 23.2 | 14.0 | 0.680 | 0.3 | 12.9 | 18.0 | 23.9 | 28.7 | 46.6 | 105.0 | 105.0 |
Geogenic Soil Lead Concentrations (mg/kg): 2007-2010 (Outliers Excluded)
| Number of Samples |
Mean |
Std Error |
95 UCL |
Std Dev |
Coeff of Variation |
Min |
Q1 |
Median |
Q3 |
90th |
95th |
99th |
Max |
|---|---|---|---|---|---|---|---|---|---|---|---|---|---|
| 85 | 19.1 | 1.0 | 20.8 | 9.3 | 0.488 | 0.3 | 12.9 | 18.0 | 23.5 | 28.4 | 33.1 | 57.7 | 57.7 |
About These Tables:
These tables show the overall occurrence of lead in surface samples as described by USGS.
Sources of These Data:
The U.S. Geological Survey provided the soil sampling data. The data display was prepared by U.S. Environmental Protection Agency. Revision Date:
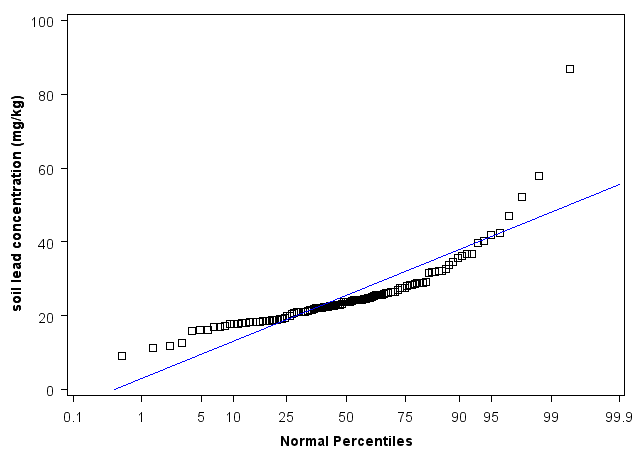
Charts
About These Charts:
These charts show the overall occurrence of lead in surface samples as described by USGS.
Sources of These Data:
The U.S. Geological Survey provided the soil sampling data. The data display was prepared by U.S. Environmental Protection Agency. Revision Date:
California State Data
Tables
Geogenic Soil Lead Concentrations (mg/kg): 2007-2010 (All Data)
| Number of Samples |
Mean |
Std Error |
95 UCL |
Std Dev |
Coeff of Variation |
Min |
Q1 |
Median |
Q3 |
90th |
95th |
99th |
Max |
|---|---|---|---|---|---|---|---|---|---|---|---|---|---|
| 258 | 19.7 | 1.3 | 21.8 | 20.4 | 1.032 | 3.0 | 12.6 | 16.8 | 20.9 | 28.1 | 33.2 | 92.7 | 263.0 |
Geogenic Soil Lead Concentrations (mg/kg): 2007-2010 (Outliers Excluded)
| Number of Samples |
Mean |
Std Error |
95 UCL |
Std Dev |
Coeff of Variation |
Min |
Q1 |
Median |
Q3 |
90th |
95th |
99th |
Max |
|---|---|---|---|---|---|---|---|---|---|---|---|---|---|
| 255 | 17.9 | 0.5 | 18.8 | 8.4 | 0.467 | 3.0 | 12.5 | 16.8 | 20.7 | 27.8 | 32.3 | 48.6 | 70.1 |
About These Tables:
These tables show the overall occurrence of lead in surface samples as described by USGS.
Sources of These Data:
The U.S. Geological Survey provided the soil sampling data. The data display was prepared by U.S. Environmental Protection Agency. Revision Date:
Charts
About These Charts:
These charts show the overall occurrence of lead in surface samples as described by USGS.
Sources of These Data:
The U.S. Geological Survey provided the soil sampling data. The data display was prepared by U.S. Environmental Protection Agency. Revision Date:
Colorado State Data
Tables
Geogenic Soil Lead Concentrations (mg/kg): 2007-2010 (All Data)
| Number of Samples |
Mean |
Std Error |
95 UCL |
Std Dev |
Coeff of Variation |
Min |
Q1 |
Median |
Q3 |
90th |
95th |
99th |
Max |
|---|---|---|---|---|---|---|---|---|---|---|---|---|---|
| 165 | 45.4 | 11.4 | 64.3 | 147.0 | 3.240 | 8.9 | 20.9 | 24.4 | 30.6 | 39.3 | 51.5 | 1010.0 | 1610.0 |
Geogenic Soil Lead Concentrations (mg/kg): 2007-2010 (Outliers Excluded)
| Number of Samples |
Mean |
Std Error |
95 UCL |
Std Dev |
Coeff of Variation |
Min |
Q1 |
Median |
Q3 |
90th |
95th |
99th |
Max |
|---|---|---|---|---|---|---|---|---|---|---|---|---|---|
| 163 | 29.8 | 2.2 | 33.5 | 27.8 | 0.932 | 8.9 | 20.8 | 24.3 | 30.5 | 38.8 | 46.8 | 170.0 | 312.0 |
About These Tables:
These tables show the overall occurrence of lead in surface samples as described by USGS.
Sources of These Data:
The U.S. Geological Survey provided the soil sampling data. The data display was prepared by U.S. Environmental Protection Agency. Revision Date:
Charts
About These Charts:
These charts show the overall occurrence of lead in surface samples as described by USGS.
Sources of These Data:
The U.S. Geological Survey provided the soil sampling data. The data display was prepared by U.S. Environmental Protection Agency. Revision Date:
Connecticut State Data
Tables
Geogenic Soil Lead Concentrations (mg/kg): 2007-2010 (All Data)
| Number of Samples |
Mean |
Std Error |
95 UCL |
Std Dev |
Coeff of Variation |
Min |
Q1 |
Median |
Q3 |
90th |
95th |
99th |
Max |
|---|---|---|---|---|---|---|---|---|---|---|---|---|---|
| 9 | 49.9 | 8.1 | 65.0 | 24.3 | 0.487 | 19.1 | 30.6 | 38.2 | 68.8 | 88.8 | 88.8 | 88.8 | 88.8 |
Geogenic Soil Lead Concentrations (mg/kg): 2007-2010 (Outliers Excluded)
| Number of Samples |
Mean |
Std Error |
95 UCL |
Std Dev |
Coeff of Variation |
Min |
Q1 |
Median |
Q3 |
90th |
95th |
99th |
Max |
|---|---|---|---|---|---|---|---|---|---|---|---|---|---|
| 9 | 49.9 | 8.1 | 65.0 | 24.3 | 0.487 | 19.1 | 30.6 | 38.2 | 68.8 | 88.8 | 88.8 | 88.8 | 88.8 |
About These Tables:
These tables show the overall occurrence of lead in surface samples as described by USGS.
Sources of These Data:
The U.S. Geological Survey provided the soil sampling data. The data display was prepared by U.S. Environmental Protection Agency. Revision Date:
Charts
About These Charts:
These charts show the overall occurrence of lead in surface samples as described by USGS.
Sources of These Data:
The U.S. Geological Survey provided the soil sampling data. The data display was prepared by U.S. Environmental Protection Agency. Revision Date:
Delaware State Data
Tables
Geogenic Soil Lead Concentrations (mg/kg): 2007-2010 (All Data)
| Number of Samples |
Mean |
Std Error |
95 UCL |
Std Dev |
Coeff of Variation |
Min |
Q1 |
Median |
Q3 |
90th |
95th |
99th |
Max |
|---|---|---|---|---|---|---|---|---|---|---|---|---|---|
| 2 | 18.2 | 4.4 | 46.0 | 6.2 | 0.342 | 13.8 | 13.8 | 18.2 | 22.6 | 22.6 | 22.6 | 22.6 | 22.6 |
Geogenic Soil Lead Concentrations (mg/kg): 2007-2010 (Outliers Excluded)
| Number of Samples |
Mean |
Std Error |
95 UCL |
Std Dev |
Coeff of Variation |
Min |
Q1 |
Median |
Q3 |
90th |
95th |
99th |
Max |
|---|---|---|---|---|---|---|---|---|---|---|---|---|---|
| 2 | 18.2 | 4.4 | 46.0 | 6.2 | 0.342 | 13.8 | 13.8 | 18.2 | 22.6 | 22.6 | 22.6 | 22.6 | 22.6 |
About These Tables:
These tables show the overall occurrence of lead in surface samples as described by USGS.
Sources of These Data:
The U.S. Geological Survey provided the soil sampling data. The data display was prepared by U.S. Environmental Protection Agency. Revision Date:
Charts
About These Charts:
These charts show the overall occurrence of lead in surface samples as described by USGS.
Sources of These Data:
The U.S. Geological Survey provided the soil sampling data. The data display was prepared by U.S. Environmental Protection Agency. Revision Date:
Florida State Data
Tables
Geogenic Soil Lead Concentrations (mg/kg): 2007-2010 (All Data)
| Number of Samples |
Mean |
Std Error |
95 UCL |
Std Dev |
Coeff of Variation |
Min |
Q1 |
Median |
Q3 |
90th |
95th |
99th |
Max |
|---|---|---|---|---|---|---|---|---|---|---|---|---|---|
| 89 | 6.4 | 0.5 | 7.3 | 4.8 | 0.753 | 0.3 | 2.5 | 4.7 | 11.1 | 11.3 | 14.0 | 29.0 | 29.0 |
Geogenic Soil Lead Concentrations (mg/kg): 2007-2010 (Outliers Excluded)
| Number of Samples |
Mean |
Std Error |
95 UCL |
Std Dev |
Coeff of Variation |
Min |
Q1 |
Median |
Q3 |
90th |
95th |
99th |
Max |
|---|---|---|---|---|---|---|---|---|---|---|---|---|---|
| 88 | 6.2 | 0.5 | 6.9 | 4.2 | 0.683 | 0.3 | 2.5 | 4.7 | 11.1 | 11.3 | 13.5 | 16.3 | 16.3 |
About These Tables:
These tables show the overall occurrence of lead in surface samples as described by USGS.
Sources of These Data:
The U.S. Geological Survey provided the soil sampling data. The data display was prepared by U.S. Environmental Protection Agency. Revision Date:
Charts
About These Charts:
These charts show the overall occurrence of lead in surface samples as described by USGS.
Sources of These Data:
The U.S. Geological Survey provided the soil sampling data. The data display was prepared by U.S. Environmental Protection Agency. Revision Date:
Georgia State Data
Tables
Geogenic Soil Lead Concentrations (mg/kg): 2007-2010 (All Data)
| Number of Samples |
Mean |
Std Error |
95 UCL |
Std Dev |
Coeff of Variation |
Min |
Q1 |
Median |
Q3 |
90th |
95th |
99th |
Max |
|---|---|---|---|---|---|---|---|---|---|---|---|---|---|
| 94 | 13.2 | 0.9 | 14.7 | 8.9 | 0.670 | 2.7 | 6.7 | 11.4 | 15.8 | 25.1 | 31.0 | 53.0 | 53.0 |
Geogenic Soil Lead Concentrations (mg/kg): 2007-2010 (Outliers Excluded)
| Number of Samples |
Mean |
Std Error |
95 UCL |
Std Dev |
Coeff of Variation |
Min |
Q1 |
Median |
Q3 |
90th |
95th |
99th |
Max |
|---|---|---|---|---|---|---|---|---|---|---|---|---|---|
| 93 | 12.8 | 0.8 | 14.2 | 7.9 | 0.615 | 2.7 | 6.7 | 11.4 | 14.7 | 24.4 | 29.5 | 38.7 | 38.7 |
About These Tables:
These tables show the overall occurrence of lead in surface samples as described by USGS.
Sources of These Data:
The U.S. Geological Survey provided the soil sampling data. The data display was prepared by U.S. Environmental Protection Agency. Revision Date:
Charts
About These Charts:
These charts show the overall occurrence of lead in surface samples as described by USGS.
Sources of These Data:
The U.S. Geological Survey provided the soil sampling data. The data display was prepared by U.S. Environmental Protection Agency. Revision Date:
Idaho State Data
Tables
Geogenic Soil Lead Concentrations (mg/kg): 2007-2010 (All Data)
| Number of Samples |
Mean |
Std Error |
95 UCL |
Std Dev |
Coeff of Variation |
Min |
Q1 |
Median |
Q3 |
90th |
95th |
99th |
Max |
|---|---|---|---|---|---|---|---|---|---|---|---|---|---|
| 131 | 25.2 | 4.3 | 32.3 | 48.8 | 1.936 | 5.5 | 15.2 | 18.5 | 21.9 | 26.6 | 32.7 | 158.0 | 541.0 |
Geogenic Soil Lead Concentrations (mg/kg): 2007-2010 (Outliers Excluded)
| Number of Samples |
Mean |
Std Error |
95 UCL |
Std Dev |
Coeff of Variation |
Min |
Q1 |
Median |
Q3 |
90th |
95th |
99th |
Max |
|---|---|---|---|---|---|---|---|---|---|---|---|---|---|
| 130 | 21.2 | 1.6 | 23.9 | 18.0 | 0.846 | 5.5 | 15.2 | 18.4 | 21.8 | 26.6 | 32.2 | 119.0 | 158.0 |
About These Tables:
These tables show the overall occurrence of lead in surface samples as described by USGS.
Sources of These Data:
The U.S. Geological Survey provided the soil sampling data. The data display was prepared by U.S. Environmental Protection Agency. Revision Date:
Charts
About These Charts:
These charts show the overall occurrence of lead in surface samples as described by USGS.
Sources of These Data:
The U.S. Geological Survey provided the soil sampling data. The data display was prepared by U.S. Environmental Protection Agency. Revision Date:
Illinois State Data
Tables
Geogenic Soil Lead Concentrations (mg/kg): 2007-2010 (All Data)
| Number of Samples |
Mean |
Std Error |
95 UCL |
Std Dev |
Coeff of Variation |
Min |
Q1 |
Median |
Q3 |
90th |
95th |
99th |
Max |
|---|---|---|---|---|---|---|---|---|---|---|---|---|---|
| 88 | 26.4 | 1.2 | 28.5 | 11.5 | 0.434 | 14.0 | 20.3 | 24.0 | 28.1 | 38.4 | 47.0 | 103.0 | 103.0 |
Geogenic Soil Lead Concentrations (mg/kg): 2007-2010 (Outliers Excluded)
| Number of Samples |
Mean |
Std Error |
95 UCL |
Std Dev |
Coeff of Variation |
Min |
Q1 |
Median |
Q3 |
90th |
95th |
99th |
Max |
|---|---|---|---|---|---|---|---|---|---|---|---|---|---|
| 87 | 25.6 | 0.9 | 27.0 | 8.0 | 0.314 | 14.0 | 20.2 | 23.8 | 28.0 | 36.5 | 45.6 | 54.1 | 54.1 |
About These Tables:
These tables show the overall occurrence of lead in surface samples as described by USGS.
Sources of These Data:
The U.S. Geological Survey provided the soil sampling data. The data display was prepared by U.S. Environmental Protection Agency. Revision Date:
Charts
About These Charts:
These charts show the overall occurrence of lead in surface samples as described by USGS.
Sources of These Data:
The U.S. Geological Survey provided the soil sampling data. The data display was prepared by U.S. Environmental Protection Agency. Revision Date:
Indiana State Data
Tables
Geogenic Soil Lead Concentrations (mg/kg): 2007-2010 (All Data)
| Number of Samples |
Mean |
Std Error |
95 UCL |
Std Dev |
Coeff of Variation |
Min |
Q1 |
Median |
Q3 |
90th |
95th |
99th |
Max |
|---|---|---|---|---|---|---|---|---|---|---|---|---|---|
| 57 | 30.7 | 7.2 | 42.8 | 54.4 | 1.771 | 8.2 | 18.6 | 21.0 | 25.7 | 29.5 | 78.5 | 423.0 | 423.0 |
Geogenic Soil Lead Concentrations (mg/kg): 2007-2010 (Outliers Excluded)
| Number of Samples |
Mean |
Std Error |
95 UCL |
Std Dev |
Coeff of Variation |
Min |
Q1 |
Median |
Q3 |
90th |
95th |
99th |
Max |
|---|---|---|---|---|---|---|---|---|---|---|---|---|---|
| 56 | 23.7 | 1.7 | 26.6 | 13.0 | 0.547 | 8.2 | 18.6 | 21.0 | 25.5 | 28.8 | 47.3 | 83.9 | 83.9 |
About These Tables:
These tables show the overall occurrence of lead in surface samples as described by USGS.
Sources of These Data:
The U.S. Geological Survey provided the soil sampling data. The data display was prepared by U.S. Environmental Protection Agency. Revision Date:
Charts
About These Charts:
These charts show the overall occurrence of lead in surface samples as described by USGS.
Sources of These Data:
The U.S. Geological Survey provided the soil sampling data. The data display was prepared by U.S. Environmental Protection Agency. Revision Date:
Iowa State Data
Tables
Geogenic Soil Lead Concentrations (mg/kg): 2007-2010 (All Data)
| Number of Samples |
Mean |
Std Error |
95 UCL |
Std Dev |
Coeff of Variation |
Min |
Q1 |
Median |
Q3 |
90th |
95th |
99th |
Max |
|---|---|---|---|---|---|---|---|---|---|---|---|---|---|
| 91 | 23.1 | 0.7 | 24.1 | 6.2 | 0.270 | 8.4 | 19.4 | 21.7 | 25.3 | 29.9 | 35.0 | 48.5 | 48.5 |
Geogenic Soil Lead Concentrations (mg/kg): 2007-2010 (Outliers Excluded)
| Number of Samples |
Mean |
Std Error |
95 UCL |
Std Dev |
Coeff of Variation |
Min |
Q1 |
Median |
Q3 |
90th |
95th |
99th |
Max |
|---|---|---|---|---|---|---|---|---|---|---|---|---|---|
| 89 | 22.5 | 0.5 | 23.4 | 5.1 | 0.229 | 8.4 | 19.4 | 21.6 | 24.7 | 29.8 | 32.5 | 38.2 | 38.2 |
About These Tables:
These tables show the overall occurrence of lead in surface samples as described by USGS.
Sources of These Data:
The U.S. Geological Survey provided the soil sampling data. The data display was prepared by U.S. Environmental Protection Agency. Revision Date:
Charts
About These Charts:
These charts show the overall occurrence of lead in surface samples as described by USGS.
Sources of These Data:
The U.S. Geological Survey provided the soil sampling data. The data display was prepared by U.S. Environmental Protection Agency. Revision Date:
Kansas State Data
Tables
Geogenic Soil Lead Concentrations (mg/kg): 2007-2010 (All Data)
| Number of Samples |
Mean |
Std Error |
95 UCL |
Std Dev |
Coeff of Variation |
Min |
Q1 |
Median |
Q3 |
90th |
95th |
99th |
Max |
|---|---|---|---|---|---|---|---|---|---|---|---|---|---|
| 132 | 26.6 | 3.3 | 32.0 | 37.9 | 1.427 | 9.8 | 19.1 | 21.3 | 25.9 | 32.4 | 38.0 | 66.9 | 450.0 |
Geogenic Soil Lead Concentrations (mg/kg): 2007-2010 (Outliers Excluded)
| Number of Samples |
Mean |
Std Error |
95 UCL |
Std Dev |
Coeff of Variation |
Min |
Q1 |
Median |
Q3 |
90th |
95th |
99th |
Max |
|---|---|---|---|---|---|---|---|---|---|---|---|---|---|
| 131 | 23.3 | 0.7 | 24.5 | 7.7 | 0.332 | 9.8 | 19.0 | 21.3 | 25.9 | 31.8 | 37.7 | 51.9 | 66.9 |
About These Tables:
These tables show the overall occurrence of lead in surface samples as described by USGS.
Sources of These Data:
The U.S. Geological Survey provided the soil sampling data. The data display was prepared by U.S. Environmental Protection Agency. Revision Date
Charts
About These Charts:
These charts show the overall occurrence of lead in surface samples as described by USGS.
Sources of These Data:
The U.S. Geological Survey provided the soil sampling data. The data display was prepared by U.S. Environmental Protection Agency. Revision Date:
Kentucky State Data
Tables
Geogenic Soil Lead Concentrations (mg/kg): 2007-2010 (All Data)
| Number of Samples |
Mean |
Std Error |
95 UCL |
Std Dev |
Coeff of Variation |
Min |
Q1 |
Median |
Q3 |
90th |
95th |
99th |
Max |
|---|---|---|---|---|---|---|---|---|---|---|---|---|---|
| 64 | 29.2 | 2.5 | 33.3 | 20.1 | 0.689 | 12.4 | 19.0 | 22.4 | 28.9 | 43.6 | 85.9 | 111.0 | 111.0 |
Geogenic Soil Lead Concentrations (mg/kg): 2007-2010 (Outliers Excluded)
| Number of Samples |
Mean |
Std Error |
95 UCL |
Std Dev |
Coeff of Variation |
Min |
Q1 |
Median |
Q3 |
90th |
95th |
99th |
Max |
|---|---|---|---|---|---|---|---|---|---|---|---|---|---|
| 61 | 25.7 | 1.6 | 28.4 | 12.5 | 0.488 | 12.4 | 19.0 | 22.3 | 26.5 | 38.7 | 43.6 | 85.9 | 85.9 |
About These Tables:
These tables show the overall occurrence of lead in surface samples as described by USGS.
Sources of These Data:
The U.S. Geological Survey provided the soil sampling data. The data display was prepared by U.S. Environmental Protection Agency. Revision Date:
Charts
About These Charts:
These charts show the overall occurrence of lead in surface samples as described by USGS.
Sources of These Data:
The U.S. Geological Survey provided the soil sampling data. The data display was prepared by U.S. Environmental Protection Agency. Revision Date:
Louisiana State Data
Tables
Geogenic Soil Lead Concentrations (mg/kg): 2007-2010 (All Data)
| Number of Samples |
Mean |
Std Error |
95 UCL |
Std Dev |
Coeff of Variation |
Min |
Q1 |
Median |
Q3 |
90th |
95th |
99th |
Max |
|---|---|---|---|---|---|---|---|---|---|---|---|---|---|
| 75 | 21.2 | 1.6 | 23.9 | 14.0 | 0.659 | 6.7 | 11.8 | 18.7 | 25.7 | 34.1 | 46.7 | 90.8 | 90.8 |
Geogenic Soil Lead Concentrations (mg/kg): 2007-2010 (Outliers Excluded)
| Number of Samples |
Mean |
Std Error |
95 UCL |
Std Dev |
Coeff of Variation |
Min |
Q1 |
Median |
Q3 |
90th |
95th |
99th |
Max |
|---|---|---|---|---|---|---|---|---|---|---|---|---|---|
| 73 | 19.5 | 1.1 | 21.2 | 9.0 | 0.464 | 6.7 | 11.8 | 18.3 | 24.8 | 31.8 | 36.2 | 47.2 | 47.2 |
About These Tables:
These tables show the overall occurrence of lead in surface samples as described by USGS.
Sources of These Data:
The U.S. Geological Survey provided the soil sampling data. The data display was prepared by U.S. Environmental Protection Agency. Revision Date:
Charts
About These Charts:
These charts show the overall occurrence of lead in surface samples as described by USGS.
Sources of These Data:
The U.S. Geological Survey provided the soil sampling data. The data display was prepared by U.S. Environmental Protection Agency. Revision Date:
Maine State Data
Tables
Geogenic Soil Lead Concentrations (mg/kg): 2007-2010 (All Data)
| Number of Samples |
Mean |
Std Error |
95 UCL |
Std Dev |
Coeff of Variation |
Min |
Q1 |
Median |
Q3 |
90th |
95th |
99th |
Max |
|---|---|---|---|---|---|---|---|---|---|---|---|---|---|
| 53 | 35.4 | 5.6 | 44.7 | 40.4 | 1.142 | 7.2 | 19.2 | 22.9 | 32.1 | 59.4 | 91.7 | 233.0 | 233.0 |
Geogenic Soil Lead Concentrations (mg/kg): 2007-2010 (Outliers Excluded)
| Number of Samples |
Mean |
Std Error |
95 UCL |
Std Dev |
Coeff of Variation |
Min |
Q1 |
Median |
Q3 |
90th |
95th |
99th |
Max |
|---|---|---|---|---|---|---|---|---|---|---|---|---|---|
| 51 | 28.1 | 2.2 | 31.8 | 15.9 | 0.567 | 7.2 | 19.1 | 22.6 | 31.1 | 43.2 | 68.4 | 91.7 | 91.7 |
About These Tables:
These tables show the overall occurrence of lead in surface samples as described by USGS.
Sources of These Data:
The U.S. Geological Survey provided the soil sampling data. The data display was prepared by U.S. Environmental Protection Agency. Revision Date:
Charts
About These Charts:
These charts show the overall occurrence of lead in surface samples as described by USGS.
Sources of These Data:
The U.S. Geological Survey provided the soil sampling data. The data display was prepared by U.S. Environmental Protection Agency. Revision Date:
Maryland State Data
Tables
Geogenic Soil Lead Concentrations (mg/kg): 2007-2010 (All Data)
| Number of Samples |
Mean |
Std Error |
95 UCL |
Std Dev |
Coeff of Variation |
Min |
Q1 |
Median |
Q3 |
90th |
95th |
99th |
Max |
|---|---|---|---|---|---|---|---|---|---|---|---|---|---|
| 18 | 42.2 | 8.8 | 57.5 | 37.1 | 0.879 | 11.7 | 19.0 | 27.6 | 45.9 | 117.0 | 150.0 | 150.0 | 150.0 |
Geogenic Soil Lead Concentrations (mg/kg): 2007-2010 (Outliers Excluded)
| Number of Samples |
Mean |
Std Error |
95 UCL |
Std Dev |
Coeff of Variation |
Min |
Q1 |
Median |
Q3 |
90th |
95th |
99th |
Max |
|---|---|---|---|---|---|---|---|---|---|---|---|---|---|
| 18 | 42.2 | 8.8 | 57.5 | 37.1 | 0.879 | 11.7 | 19.0 | 27.6 | 45.9 | 117.0 | 150.0 | 150.0 | 150.0 |
About These Tables:
These tables show the overall occurrence of lead in surface samples as described by USGS.
Sources of These Data:
The U.S. Geological Survey provided the soil sampling data. The data display was prepared by U.S. Environmental Protection Agency. Revision Date:
Charts
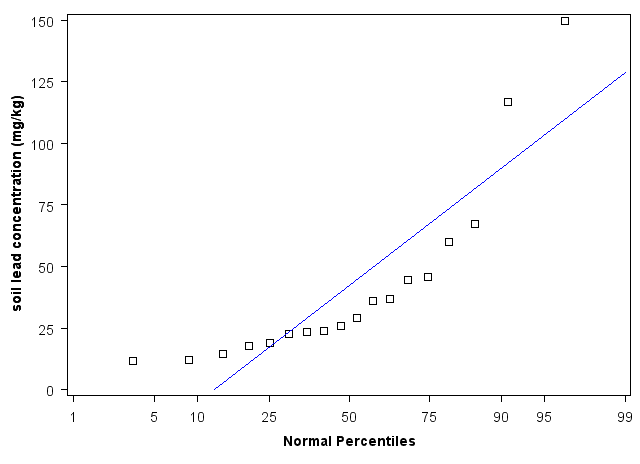
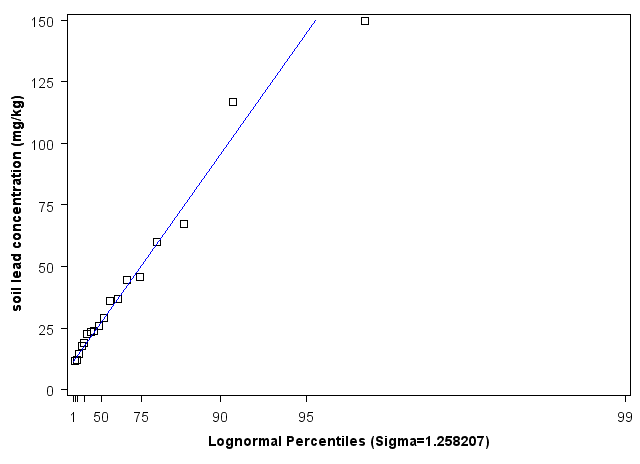
About These Charts:
These charts show the overall occurrence of lead in surface samples as described by USGS.
Sources of These Data:
The U.S. Geological Survey provided the soil sampling data. The data display was prepared by U.S. Environmental Protection Agency. Revision Date:
Massachusetts State Data
Tables
Geogenic Soil Lead Concentrations (mg/kg): 2007-2010 (All Data)
| Number of Samples |
Mean |
Std Error |
95 UCL |
Std Dev |
Coeff of Variation |
Min |
Q1 |
Median |
Q3 |
90th |
95th |
99th |
Max |
|---|---|---|---|---|---|---|---|---|---|---|---|---|---|
| 14 | 72.2 | 20.6 | 108.6 | 77.0 | 1.067 | 24.2 | 34.2 | 53.4 | 71.6 | 109.0 | 327.0 | 327.0 | 327.0 |
Geogenic Soil Lead Concentrations (mg/kg): 2007-2010 (Outliers Excluded)
| Number of Samples |
Mean |
Std Error |
95 UCL |
Std Dev |
Coeff of Variation |
Min |
Q1 |
Median |
Q3 |
90th |
95th |
99th |
Max |
|---|---|---|---|---|---|---|---|---|---|---|---|---|---|
| 13 | 52.6 | 6.8 | 64.7 | 24.5 | 0.466 | 24.2 | 34.2 | 44.3 | 64.9 | 76.4 | 109.0 | 109.0 | 109.0 |
About These Tables:
These tables show the overall occurrence of lead in surface samples as described by USGS.
Sources of These Data:
The U.S. Geological Survey provided the soil sampling data. The data display was prepared by U.S. Environmental Protection Agency. Revision Date:
Charts
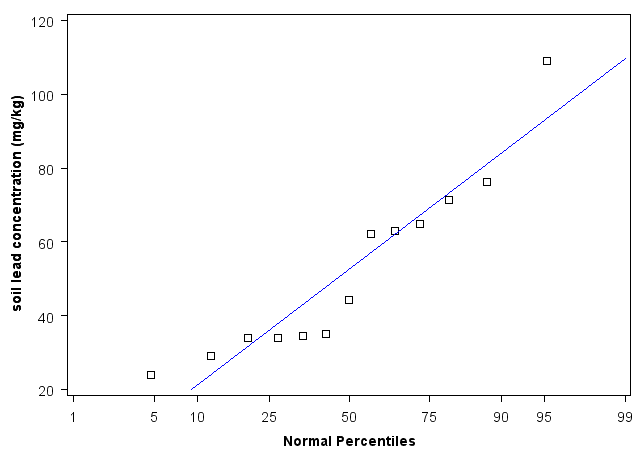
About These Charts:
These charts show the overall occurrence of lead in surface samples as described by USGS.
Sources of These Data:
The U.S. Geological Survey provided the soil sampling data. The data display was prepared by U.S. Environmental Protection Agency. Revision Date:
Michigan State Data
Tables
Geogenic Soil Lead Concentrations (mg/kg): 2007-2010 (All Data)
| Number of Samples |
Mean |
Std Error |
95 UCL |
Std Dev |
Coeff of Variation |
Min |
Q1 |
Median |
Q3 |
90th |
95th |
99th |
Max |
|---|---|---|---|---|---|---|---|---|---|---|---|---|---|
| 95 | 17.1 | 0.8 | 18.4 | 7.4 | 0.432 | 8.3 | 12.6 | 15.2 | 18.5 | 28.0 | 31.2 | 56.6 | 56.6 |
Geogenic Soil Lead Concentrations (mg/kg): 2007-2010 (Outliers Excluded)
| Number of Samples |
Mean |
Std Error |
95 UCL |
Std Dev |
Coeff of Variation |
Min |
Q1 |
Median |
Q3 |
90th |
95th |
99th |
Max |
|---|---|---|---|---|---|---|---|---|---|---|---|---|---|
| 93 | 16.4 | 0.6 | 17.4 | 5.7 | 0.347 | 8.3 | 12.6 | 15.1 | 18.2 | 24.5 | 28.9 | 35.6 | 35.6 |
About These Tables:
These tables show the overall occurrence of lead in surface samples as described by USGS.
Sources of These Data:
The U.S. Geological Survey provided the soil sampling data. The data display was prepared by U.S. Environmental Protection Agency. Revision Date:
Charts
About These Charts:
These charts show the overall occurrence of lead in surface samples as described by USGS.
Sources of These Data:
The U.S. Geological Survey provided the soil sampling data. The data display was prepared by U.S. Environmental Protection Agency. Revision Date:
Minnesota State Data
Tables
Geogenic Soil Lead Concentrations (mg/kg): 2007-2010 (All Data)
| Number of Samples |
Mean |
Std Error |
95 UCL |
Std Dev |
Coeff of Variation |
Min |
Q1 |
Median |
Q3 |
90th |
95th |
99th |
Max |
|---|---|---|---|---|---|---|---|---|---|---|---|---|---|
| 137 | 16.6 | 0.4 | 17.3 | 4.9 | 0.292 | 3.6 | 13.7 | 16.1 | 18.2 | 21.8 | 26.6 | 34.6 | 37.2 |
Geogenic Soil Lead Concentrations (mg/kg): 2007-2010 (Outliers Excluded)
| Number of Samples |
Mean |
Std Error |
95 UCL |
Std Dev |
Coeff of Variation |
Min |
Q1 |
Median |
Q3 |
90th |
95th |
99th |
Max |
|---|---|---|---|---|---|---|---|---|---|---|---|---|---|
| 134 | 16.2 | 0.4 | 16.8 | 4.1 | 0.251 | 3.6 | 13.5 | 16.0 | 18.2 | 20.8 | 22.8 | 29.2 | 29.8 |
About These Tables:
These tables show the overall occurrence of lead in surface samples as described by USGS.
Sources of These Data:
The U.S. Geological Survey provided the soil sampling data. The data display was prepared by U.S. Environmental Protection Agency. Revision Date:
Charts
About These Charts:
These charts show the overall occurrence of lead in surface samples as described by USGS.
Sources of These Data:
The U.S. Geological Survey provided the soil sampling data. The data display was prepared by U.S. Environmental Protection Agency. Revision Date:
Mississippi State Data
Tables
Geogenic Soil Lead Concentrations (mg/kg): 2007-2010 (All Data)
| Number of Samples |
Mean |
Std Error |
95 UCL |
Std Dev |
Coeff of Variation |
Min |
Q1 |
Median |
Q3 |
90th |
95th |
99th |
Max |
|---|---|---|---|---|---|---|---|---|---|---|---|---|---|
| 77 | 22.2 | 2.8 | 26.9 | 24.7 | 1.110 | 4.5 | 12.7 | 16.4 | 21.8 | 33.6 | 52.7 | 181.0 | 181.0 |
Geogenic Soil Lead Concentrations (mg/kg): 2007-2010 (Outliers Excluded)
| Number of Samples |
Mean |
Std Error |
95 UCL |
Std Dev |
Coeff of Variation |
Min |
Q1 |
Median |
Q3 |
90th |
95th |
99th |
Max |
|---|---|---|---|---|---|---|---|---|---|---|---|---|---|
| 75 | 18.6 | 1.2 | 20.6 | 10.3 | 0.552 | 4.5 | 12.3 | 16.0 | 21.6 | 32.0 | 43.1 | 55.1 | 55.1 |
About These Tables:
These tables show the overall occurrence of lead in surface samples as described by USGS.
Sources of These Data:
The U.S. Geological Survey provided the soil sampling data. The data display was prepared by U.S. Environmental Protection Agency. Revision Date:
Charts
About These Charts:
These charts show the overall occurrence of lead in surface samples as described by USGS.
Sources of These Data:
The U.S. Geological Survey provided the soil sampling data. The data display was prepared by U.S. Environmental Protection Agency. Revision Date:
Missouri State Data
Tables
Geogenic Soil Lead Concentrations (mg/kg): 2007-2010 (All Data)
| Number of Samples |
Mean |
Std Error |
95 UCL |
Std Dev |
Coeff of Variation |
Min |
Q1 |
Median |
Q3 |
90th |
95th |
99th |
Max |
|---|---|---|---|---|---|---|---|---|---|---|---|---|---|
| 115 | 29.2 | 2.8 | 33.9 | 30.5 | 1.044 | 9.3 | 20.0 | 24.0 | 28.4 | 36.9 | 47.1 | 176.0 | 298.0 |
Geogenic Soil Lead Concentrations (mg/kg): 2007-2010 (Outliers Excluded)
| Number of Samples |
Mean |
Std Error |
95 UCL |
Std Dev |
Coeff of Variation |
Min |
Q1 |
Median |
Q3 |
90th |
95th |
99th |
Max |
|---|---|---|---|---|---|---|---|---|---|---|---|---|---|
| 113 | 25.5 | 0.9 | 27.0 | 9.7 | 0.380 | 9.3 | 20.0 | 23.9 | 27.8 | 35.7 | 42.1 | 57.9 | 87.0 |
About These Tables:
These tables show the overall occurrence of lead in surface samples as described by USGS.
Sources of These Data:
The U.S. Geological Survey provided the soil sampling data. The data display was prepared by U.S. Environmental Protection Agency. Revision Date:
Charts
About These Charts:
These charts show the overall occurrence of lead in surface samples as described by USGS.
Sources of These Data:
The U.S. Geological Survey provided the soil sampling data. The data display was prepared by U.S. Environmental Protection Agency. Revision Date:
Montana State Data
Tables
Geogenic Soil Lead Concentrations (mg/kg): 2007-2010 (All Data)
| Number of Samples |
Mean |
Std Error |
95 UCL |
Std Dev |
Coeff of Variation |
Min |
Q1 |
Median |
Q3 |
90th |
95th |
99th |
Max |
|---|---|---|---|---|---|---|---|---|---|---|---|---|---|
| 239 | 19.8 | 0.7 | 21.0 | 10.9 | 0.550 | 4.2 | 14.6 | 17.2 | 21.1 | 27.5 | 40.3 | 61.9 | 113.0 |
Geogenic Soil Lead Concentrations (mg/kg): 2007-2010 (Outliers Excluded)
| Number of Samples |
Mean |
Std Error |
95 UCL |
Std Dev |
Coeff of Variation |
Min |
Q1 |
Median |
Q3 |
90th |
95th |
99th |
Max |
|---|---|---|---|---|---|---|---|---|---|---|---|---|---|
| 232 | 18.4 | 0.4 | 19.1 | 6.5 | 0.352 | 4.2 | 14.6 | 17.2 | 20.6 | 25.2 | 31.6 | 42.3 | 47.4 |
About These Tables:
These tables show the overall occurrence of lead in surface samples as described by USGS.
Sources of These Data:
The U.S. Geological Survey provided the soil sampling data. The data display was prepared by U.S. Environmental Protection Agency. Revision Date:
Charts
About These Charts:
These charts show the overall occurrence of lead in surface samples as described by USGS.
Sources of These Data:
The U.S. Geological Survey provided the soil sampling data. The data display was prepared by U.S. Environmental Protection Agency. Revision Date:
Nebraska State Data
Tables
Geogenic Soil Lead Concentrations (mg/kg): 2007-2010 (All Data)
| Number of Samples |
Mean |
Std Error |
95 UCL |
Std Dev |
Coeff of Variation |
Min |
Q1 |
Median |
Q3 |
90th |
95th |
99th |
Max |
|---|---|---|---|---|---|---|---|---|---|---|---|---|---|
| 130 | 18.9 | 0.8 | 20.3 | 9.4 | 0.495 | 9.1 | 14.8 | 18.5 | 21.6 | 25.2 | 26.4 | 29.2 | 110.0 |
Geogenic Soil Lead Concentrations (mg/kg): 2007-2010 (Outliers Excluded)
| Number of Samples |
Mean |
Std Error |
95 UCL |
Std Dev |
Coeff of Variation |
Min |
Q1 |
Median |
Q3 |
90th |
95th |
99th |
Max |
|---|---|---|---|---|---|---|---|---|---|---|---|---|---|
| 129 | 18.2 | 0.4 | 18.9 | 4.8 | 0.264 | 9.1 | 14.8 | 18.5 | 21.5 | 24.8 | 26.3 | 28.9 | 29.2 |
About These Tables:
These tables show the overall occurrence of lead in surface samples as described by USGS.
Sources of These Data:
The U.S. Geological Survey provided the soil sampling data. The data display was prepared by U.S. Environmental Protection Agency. Revision Date:
Charts
About These Charts:
These charts show the overall occurrence of lead in surface samples as described by USGS.
Sources of These Data:
The U.S. Geological Survey provided the soil sampling data. The data display was prepared by U.S. Environmental Protection Agency. Revision Date:
Nevada State Data
Tables
Geogenic Soil Lead Concentrations (mg/kg): 2007-2010 (All Data)
| Number of Samples |
Mean |
Std Error |
95 UCL |
Std Dev |
Coeff of Variation |
Min |
Q1 |
Median |
Q3 |
90th |
95th |
99th |
Max |
|---|---|---|---|---|---|---|---|---|---|---|---|---|---|
| 171 | 80.2 | 58.4 | 176.7 | 763.1 | 9.521 | 6.1 | 16.8 | 21.1 | 25.5 | 30.2 | 33.0 | 76.5 | 10000.0 |
Geogenic Soil Lead Concentrations (mg/kg): 2007-2010 (Outliers Excluded)
| Number of Samples |
Mean |
Std Error |
95 UCL |
Std Dev |
Coeff of Variation |
Min |
Q1 |
Median |
Q3 |
90th |
95th |
99th |
Max |
|---|---|---|---|---|---|---|---|---|---|---|---|---|---|
| 170 | 21.8 | 0.6 | 22.8 | 7.8 | 0.356 | 6.1 | 16.8 | 21.1 | 25.2 | 30.1 | 31.3 | 50.3 | 76.5 |
About These Tables:
These tables show the overall occurrence of lead in surface samples as described by USGS.
Sources of These Data:
The U.S. Geological Survey provided the soil sampling data. The data display was prepared by U.S. Environmental Protection Agency. Revision Date:
Charts
About These Charts:
These charts show the overall occurrence of lead in surface samples as described by USGS.
Sources of These Data:
The U.S. Geological Survey provided the soil sampling data. The data display was prepared by U.S. Environmental Protection Agency. Revision Date:
New Hampshire State Data
Tables
Geogenic Soil Lead Concentrations (mg/kg): 2007-2010 (All Data)
| Number of Samples |
Mean |
Std Error |
95 UCL |
Std Dev |
Coeff of Variation |
Min |
Q1 |
Median |
Q3 |
90th |
95th |
99th |
Max |
|---|---|---|---|---|---|---|---|---|---|---|---|---|---|
| 15 | 54.6 | 10.9 | 73.7 | 42.0 | 0.770 | 20.4 | 28.1 | 36.2 | 73.5 | 112.0 | 174.0 | 174.0 | 174.0 |
Geogenic Soil Lead Concentrations (mg/kg): 2007-2010 (Outliers Excluded)
| Number of Samples |
Mean |
Std Error |
95 UCL |
Std Dev |
Coeff of Variation |
Min |
Q1 |
Median |
Q3 |
90th |
95th |
99th |
Max |
|---|---|---|---|---|---|---|---|---|---|---|---|---|---|
| 15 | 54.6 | 10.9 | 73.7 | 42.0 | 0.770 | 20.4 | 28.1 | 36.2 | 73.5 | 112.0 | 174.0 | 174.0 | 174.0 |
About These Tables:
These tables show the overall occurrence of lead in surface samples as described by USGS.
Sources of These Data:
The U.S. Geological Survey provided the soil sampling data. The data display was prepared by U.S. Environmental Protection Agency. Revision Date
Charts

About These Charts:
These charts show the overall occurrence of lead in surface samples as described by USGS.
Sources of These Data:
The U.S. Geological Survey provided the soil sampling data. The data display was prepared by U.S. Environmental Protection Agency. Revision Date:
New Jersey State Data
Tables
Geogenic Soil Lead Concentrations (mg/kg): 2007-2010 (All Data)
| Number of Samples |
Mean |
Std Error |
95 UCL |
Std Dev |
Coeff of Variation |
Min |
Q1 |
Median |
Q3 |
90th |
95th |
99th |
Max |
|---|---|---|---|---|---|---|---|---|---|---|---|---|---|
| 13 | 75.5 | 29.3 | 127.7 | 105.6 | 1.399 | 13.1 | 20.8 | 22.7 | 104.0 | 142.0 | 398.0 | 398.0 | 398.0 |
Geogenic Soil Lead Concentrations (mg/kg): 2007-2010 (Outliers Excluded)
| Number of Samples |
Mean |
Std Error |
95 UCL |
Std Dev |
Coeff of Variation |
Min |
Q1 |
Median |
Q3 |
90th |
95th |
99th |
Max |
|---|---|---|---|---|---|---|---|---|---|---|---|---|---|
| 12 | 48.6 | 12.6 | 71.3 | 43.8 | 0.901 | 13.1 | 20.5 | 22.7 | 79.9 | 106.0 | 142.0 | 142.0 | 142.0 |
About These Tables:
These tables show the overall occurrence of lead in surface samples as described by USGS.
Sources of These Data:
The U.S. Geological Survey provided the soil sampling data. The data display was prepared by U.S. Environmental Protection Agency. Revision Date:
Charts
About These Charts:
These charts show the overall occurrence of lead in surface samples as described by USGS.
Sources of These Data:
The U.S. Geological Survey provided the soil sampling data. The data display was prepared by U.S. Environmental Protection Agency. Revision Date:
New Mexico State Data
Tables
Geogenic Soil Lead Concentrations (mg/kg): 2007-2010 (All Data)
| Number of Samples |
Mean |
Std Error |
95 UCL |
Std Dev |
Coeff of Variation |
Min |
Q1 |
Median |
Q3 |
90th |
95th |
99th |
Max |
|---|---|---|---|---|---|---|---|---|---|---|---|---|---|
| 203 | 16.3 | 0.4 | 17.0 | 6.4 | 0.390 | 1.1 | 12.4 | 15.8 | 19.3 | 24.4 | 26.9 | 39.1 | 43.9 |
Geogenic Soil Lead Concentrations (mg/kg): 2007-2010 (Outliers Excluded)
| Number of Samples |
Mean |
Std Error |
95 UCL |
Std Dev |
Coeff of Variation |
Min |
Q1 |
Median |
Q3 |
90th |
95th |
99th |
Max |
|---|---|---|---|---|---|---|---|---|---|---|---|---|---|
| 200 | 15.9 | 0.4 | 16.6 | 5.6 | 0.353 | 1.1 | 12.3 | 15.8 | 18.9 | 24.1 | 26.0 | 29.7 | 30.3 |
About These Tables:
These tables show the overall occurrence of lead in surface samples as described by USGS.
Sources of These Data:
The U.S. Geological Survey provided the soil sampling data. The data display was prepared by U.S. Environmental Protection Agency. Revision Date:
Charts
About These Charts:
These charts show the overall occurrence of lead in surface samples as described by USGS.
Sources of These Data:
The U.S. Geological Survey provided the soil sampling data. The data display was prepared by U.S. Environmental Protection Agency. Revision Date:
New York State Data
Tables
Geogenic Soil Lead Concentrations (mg/kg): 2007-2010 (All Data)
| Number of Samples |
Mean |
Std Error |
95 UCL |
Std Dev |
Coeff of Variation |
Min |
Q1 |
Median |
Q3 |
90th |
95th |
99th |
Max |
|---|---|---|---|---|---|---|---|---|---|---|---|---|---|
| 72 | 43.0 | 5.4 | 52.0 | 45.4 | 1.055 | 10.2 | 20.6 | 28.6 | 45.4 | 69.4 | 98.1 | 276.0 | 276.0 |
Geogenic Soil Lead Concentrations (mg/kg): 2007-2010 (Outliers Excluded)
| Number of Samples |
Mean |
Std Error |
95 UCL |
Std Dev |
Coeff of Variation |
Min |
Q1 |
Median |
Q3 |
90th |
95th |
99th |
Max |
|---|---|---|---|---|---|---|---|---|---|---|---|---|---|
| 70 | 36.4 | 2.7 | 41.0 | 22.9 | 0.628 | 10.2 | 20.4 | 27.8 | 43.8 | 68.6 | 90.9 | 112.0 | 112.0 |
About These Tables:
These tables show the overall occurrence of lead in surface samples as described by USGS.
Sources of These Data:
The U.S. Geological Survey provided the soil sampling data. The data display was prepared by U.S. Environmental Protection Agency. Revision Date:
Charts
About These Charts:
These charts show the overall occurrence of lead in surface samples as described by USGS.
Sources of These Data:
The U.S. Geological Survey provided the soil sampling data. The data display was prepared by U.S. Environmental Protection Agency. Revision Date:
North Carolina State Data
Tables
Geogenic Soil Lead Concentrations (mg/kg): 2007-2010 (All Data)
| Number of Samples |
Mean |
Std Error |
95 UCL |
Std Dev |
Coeff of Variation |
Min |
Q1 |
Median |
Q3 |
90th |
95th |
99th |
Max |
|---|---|---|---|---|---|---|---|---|---|---|---|---|---|
| 83 | 21.3 | 1.6 | 23.9 | 14.2 | 0.665 | 1.5 | 13.1 | 19.4 | 26.2 | 32.4 | 37.3 | 114.0 | 114.0 |
Geogenic Soil Lead Concentrations (mg/kg): 2007-2010 (Outliers Excluded)
| Number of Samples |
Mean |
Std Error |
95 UCL |
Std Dev |
Coeff of Variation |
Min |
Q1 |
Median |
Q3 |
90th |
95th |
99th |
Max |
|---|---|---|---|---|---|---|---|---|---|---|---|---|---|
| 82 | 20.2 | 1.1 | 22.0 | 9.8 | 0.487 | 1.5 | 13.1 | 19.4 | 24.8 | 32.1 | 36.6 | 50.9 | 50.9 |
About These Tables:
These tables show the overall occurrence of lead in surface samples as described by USGS.
Sources of These Data:
The U.S. Geological Survey provided the soil sampling data. The data display was prepared by U.S. Environmental Protection Agency. Revision Date:
Charts
About These Charts:
These charts show the overall occurrence of lead in surface samples as described by USGS.
Sources of These Data:
The U.S. Geological Survey provided the soil sampling data. The data display was prepared by U.S. Environmental Protection Agency. Revision Date:
North Dakota State Data
Tables
Geogenic Soil Lead Concentrations (mg/kg): 2007-2010 (All Data)
| Number of Samples |
Mean |
Std Error |
95 UCL |
Std Dev |
Coeff of Variation |
Min |
Q1 |
Median |
Q3 |
90th |
95th |
99th |
Max |
|---|---|---|---|---|---|---|---|---|---|---|---|---|---|
| 118 | 13.6 | 0.2 | 13.9 | 2.4 | 0.177 | 8.6 | 12.0 | 13.3 | 14.7 | 16.0 | 18.0 | 22.2 | 25.1 |
Geogenic Soil Lead Concentrations (mg/kg): 2007-2010 (Outliers Excluded)
| Number of Samples |
Mean |
Std Error |
95 UCL |
Std Dev |
Coeff of Variation |
Min |
Q1 |
Median |
Q3 |
90th |
95th |
99th |
Max |
|---|---|---|---|---|---|---|---|---|---|---|---|---|---|
| 116 | 13.4 | 0.2 | 13.7 | 2.0 | 0.150 | 8.6 | 12.0 | 13.3 | 14.7 | 15.6 | 17.8 | 18.7 | 18.9 |
About These Tables:
These tables show the overall occurrence of lead in surface samples as described by USGS.
Sources of These Data:
The U.S. Geological Survey provided the soil sampling data. The data display was prepared by U.S. Environmental Protection Agency. Revision Date:
Charts
About These Charts:
These charts show the overall occurrence of lead in surface samples as described by USGS.
Sources of These Data:
The U.S. Geological Survey provided the soil sampling data. The data display was prepared by U.S. Environmental Protection Agency. Revision Date:
Ohio State Data
Tables
Geogenic Soil Lead Concentrations (mg/kg): 2007-2010 (All Data)
| Number of Samples |
Mean |
Std Error |
95 UCL |
Std Dev |
Coeff of Variation |
Min |
Q1 |
Median |
Q3 |
90th |
95th |
99th |
Max |
|---|---|---|---|---|---|---|---|---|---|---|---|---|---|
| 68 | 33.9 | 2.0 | 37.3 | 16.9 | 0.498 | 16.6 | 25.7 | 30.0 | 37.5 | 47.4 | 49.6 | 148.0 | 148.0 |
Geogenic Soil Lead Concentrations (mg/kg): 2007-2010 (Outliers Excluded)
| Number of Samples |
Mean |
Std Error |
95 UCL |
Std Dev |
Coeff of Variation |
Min |
Q1 |
Median |
Q3 |
90th |
95th |
99th |
Max |
|---|---|---|---|---|---|---|---|---|---|---|---|---|---|
| 67 | 32.2 | 1.2 | 34.1 | 9.4 | 0.293 | 16.6 | 25.6 | 29.8 | 37.5 | 43.9 | 48.9 | 75.0 | 75.0 |
About These Tables:
These tables show the overall occurrence of lead in surface samples as described by USGS.
Sources of These Data:
The U.S. Geological Survey provided the soil sampling data. The data display was prepared by U.S. Environmental Protection Agency. Revision Date:
Charts
About These Charts:
These charts show the overall occurrence of lead in surface samples as described by USGS.
Sources of These Data:
The U.S. Geological Survey provided the soil sampling data. The data display was prepared by U.S. Environmental Protection Agency. Revision Date:
Oklahoma State Data
Tables
Geogenic Soil Lead Concentrations (mg/kg): 2007-2010 (All Data)
| Number of Samples |
Mean |
Std Error |
95 UCL |
Std Dev |
Coeff of Variation |
Min |
Q1 |
Median |
Q3 |
90th |
95th |
99th |
Max |
|---|---|---|---|---|---|---|---|---|---|---|---|---|---|
| 112 | 17.1 | 1.1 | 18.9 | 12.1 | 0.708 | 5.3 | 11.5 | 13.7 | 18.4 | 24.1 | 41.1 | 47.6 | 109.0 |
Geogenic Soil Lead Concentrations (mg/kg): 2007-2010 (Outliers Excluded)
| Number of Samples |
Mean |
Std Error |
95 UCL |
Std Dev |
Coeff of Variation |
Min |
Q1 |
Median |
Q3 |
90th |
95th |
99th |
Max |
|---|---|---|---|---|---|---|---|---|---|---|---|---|---|
| 111 | 16.2 | 0.8 | 17.5 | 8.3 | 0.514 | 5.3 | 11.4 | 13.7 | 18.2 | 23.6 | 40.7 | 46.4 | 47.6 |
About These Tables:
These tables show the overall occurrence of lead in surface samples as described by USGS.
Sources of These Data:
The U.S. Geological Survey provided the soil sampling data. The data display was prepared by U.S. Environmental Protection Agency. Revision Date:
Charts
About These Charts:
These charts show the overall occurrence of lead in surface samples as described by USGS.
Sources of These Data:
The U.S. Geological Survey provided the soil sampling data. The data display was prepared by U.S. Environmental Protection Agency. Revision Date:
Oregon State Data
Tables
Geogenic Soil Lead Concentrations (mg/kg): 2007-2010 (All Data)
| Number of Samples |
Mean |
Std Error |
95 UCL |
Std Dev |
Coeff of Variation |
Min |
Q1 |
Median |
Q3 |
90th |
95th |
99th |
Max |
|---|---|---|---|---|---|---|---|---|---|---|---|---|---|
| 152 | 15.5 | 0.9 | 17.1 | 11.6 | 0.749 | 2.7 | 10.6 | 13.5 | 16.9 | 23.0 | 26.9 | 65.1 | 126.0 |
Geogenic Soil Lead Concentrations (mg/kg): 2007-2010 (Outliers Excluded)
| Number of Samples |
Mean |
Std Error |
95 UCL |
Std Dev |
Coeff of Variation |
Min |
Q1 |
Median |
Q3 |
90th |
95th |
99th |
Max |
|---|---|---|---|---|---|---|---|---|---|---|---|---|---|
| 150 | 14.4 | 0.5 | 15.3 | 6.1 | 0.421 | 2.7 | 10.6 | 13.4 | 16.8 | 22.1 | 24.9 | 34.4 | 44.7 |
About These Tables:
These tables show the overall occurrence of lead in surface samples as described by USGS.
Sources of These Data:
The U.S. Geological Survey provided the soil sampling data. The data display was prepared by U.S. Environmental Protection Agency. Revision Date:
Charts
About These Charts:
These charts show the overall occurrence of lead in surface samples as described by USGS.
Sources of These Data:
The U.S. Geological Survey provided the soil sampling data. The data display was prepared by U.S. Environmental Protection Agency. Revision Date:
Pennsylvania State Data
Tables
Geogenic Soil Lead Concentrations (mg/kg): 2007-2010 (All Data)
| Number of Samples |
Mean |
Std Error |
95 UCL |
Std Dev |
Coeff of Variation |
Min |
Q1 |
Median |
Q3 |
90th |
95th |
99th |
Max |
|---|---|---|---|---|---|---|---|---|---|---|---|---|---|
| 75 | 60.2 | 5.3 | 68.9 | 45.6 | 0.758 | 14.7 | 31.8 | 46.4 | 69.3 | 118.0 | 153.0 | 261.0 | 261.0 |
Geogenic Soil Lead Concentrations (mg/kg): 2007-2010 (Outliers Excluded)
| Number of Samples |
Mean |
Std Error |
95 UCL |
Std Dev |
Coeff of Variation |
Min |
Q1 |
Median |
Q3 |
90th |
95th |
99th |
Max |
|---|---|---|---|---|---|---|---|---|---|---|---|---|---|
| 73 | 55.0 | 3.9 | 61.4 | 33.2 | 0.605 | 14.7 | 31.8 | 46.1 | 66.5 | 105.0 | 132.0 | 161.0 | 161.0 |
About These Tables:
These tables show the overall occurrence of lead in surface samples as described by USGS.
Sources of These Data:
The U.S. Geological Survey provided the soil sampling data. The data display was prepared by U.S. Environmental Protection Agency. Revision Date:
Charts
About These Charts:
These charts show the overall occurrence of lead in surface samples as described by USGS.
Sources of These Data:
The U.S. Geological Survey provided the soil sampling data. The data display was prepared by U.S. Environmental Protection Agency. Revision Date:
Rhode Island State Data
Tables
Geogenic Soil Lead Concentrations (mg/kg): 2007-2010 (All Data)
| Number of Samples |
Mean |
Std Error |
95 UCL |
Std Dev |
Coeff of Variation |
Min |
Q1 |
Median |
Q3 |
90th |
95th |
99th |
Max |
|---|---|---|---|---|---|---|---|---|---|---|---|---|---|
| 1 | 44.4 | - | - | - | - | 44.4 | 44.4 | 44.4 | 44.4 | 44.4 | 44.4 | 44.4 | 44.4 |
Geogenic Soil Lead Concentrations (mg/kg): 2007-2010 (Outliers Excluded)
| Number of Samples |
Mean |
Std Error |
95 UCL |
Std Dev |
Coeff of Variation |
Min |
Q1 |
Median |
Q3 |
90th |
95th |
99th |
Max |
|---|---|---|---|---|---|---|---|---|---|---|---|---|---|
| Insufficient sample size | |||||||||||||
About These Tables:
These tables show the overall occurrence of lead in surface samples as described by USGS.
Sources of These Data:
The U.S. Geological Survey provided the soil sampling data. The data display was prepared by U.S. Environmental Protection Agency. Revision Date:
Charts
No charts available due to insufficient sample size.
About These Charts:
These charts show the overall occurrence of lead in surface samples as described by USGS.
Sources of These Data:
The U.S. Geological Survey provided the soil sampling data. The data display was prepared by U.S. Environmental Protection Agency. Revision Date:
South Carolina State Data
Tables
Geogenic Soil Lead Concentrations (mg/kg): 2007-2010 (All Data)
| Number of Samples |
Mean |
Std Error |
95 UCL |
Std Dev |
Coeff of Variation |
Min |
Q1 |
Median |
Q3 |
90th |
95th |
99th |
Max |
|---|---|---|---|---|---|---|---|---|---|---|---|---|---|
| 50 | 15.9 | 2.0 | 19.2 | 13.9 | 0.870 | 4.0 | 7.5 | 11.9 | 21.8 | 29.6 | 33.4 | 89.4 | 89.4 |
Geogenic Soil Lead Concentrations (mg/kg): 2007-2010 (Outliers Excluded)
| Number of Samples |
Mean |
Std Error |
95 UCL |
Std Dev |
Coeff of Variation |
Min |
Q1 |
Median |
Q3 |
90th |
95th |
99th |
Max |
|---|---|---|---|---|---|---|---|---|---|---|---|---|---|
| 49 | 14.4 | 1.3 | 16.6 | 9.0 | 0.625 | 4.0 | 7.5 | 11.7 | 21.2 | 28.2 | 33.0 | 34.8 | 34.8 |
About These Tables:
These tables show the overall occurrence of lead in surface samples as described by USGS.
Sources of These Data:
The U.S. Geological Survey provided the soil sampling data. The data display was prepared by U.S. Environmental Protection Agency. Revision Date
Charts
About These Charts:
These charts show the overall occurrence of lead in surface samples as described by USGS.
Sources of These Data:
The U.S. Geological Survey provided the soil sampling data. The data display was prepared by U.S. Environmental Protection Agency. Revision Date:
South Dakota State Data
Tables
Geogenic Soil Lead Concentrations (mg/kg): 2007-2010 (All Data)
| Number of Samples |
Mean |
Std Error |
95 UCL |
Std Dev |
Coeff of Variation |
Min |
Q1 |
Median |
Q3 |
90th |
95th |
99th |
Max |
|---|---|---|---|---|---|---|---|---|---|---|---|---|---|
| 120 | 17.3 | 0.3 | 17.8 | 3.6 | 0.207 | 10.7 | 14.9 | 17.1 | 19.2 | 22.1 | 23.2 | 28.0 | 32.9 |
Geogenic Soil Lead Concentrations (mg/kg): 2007-2010 (Outliers Excluded)
| Number of Samples |
Mean |
Std Error |
95 UCL |
Std Dev |
Coeff of Variation |
Min |
Q1 |
Median |
Q3 |
90th |
95th |
99th |
Max |
|---|---|---|---|---|---|---|---|---|---|---|---|---|---|
| 119 | 17.2 | 0.3 | 17.7 | 3.3 | 0.192 | 10.7 | 14.8 | 17.0 | 19.1 | 22.0 | 23.1 | 24.3 | 28.0 |
About These Tables:
These tables show the overall occurrence of lead in surface samples as described by USGS.
Sources of These Data:
The U.S. Geological Survey provided the soil sampling data. The data display was prepared by U.S. Environmental Protection Agency. Revision Date:
Charts
About These Charts:
These charts show the overall occurrence of lead in surface samples as described by USGS.
Sources of These Data:
The U.S. Geological Survey provided the soil sampling data. The data display was prepared by U.S. Environmental Protection Agency. Revision Date:
Tennessee State Data
Tables
Geogenic Soil Lead Concentrations (mg/kg): 2007-2010 (All Data)
| Number of Samples |
Mean |
Std Error |
95 UCL |
Std Dev |
Coeff of Variation |
Min |
Q1 |
Median |
Q3 |
90th |
95th |
99th |
Max |
|---|---|---|---|---|---|---|---|---|---|---|---|---|---|
| 66 | 25.3 | 2.1 | 28.7 | 16.7 | 0.662 | 11.5 | 18.8 | 21.5 | 27.5 | 33.7 | 42.5 | 138.0 | 138.0 |
Geogenic Soil Lead Concentrations (mg/kg): 2007-2010 (Outliers Excluded)
| Number of Samples |
Mean |
Std Error |
95 UCL |
Std Dev |
Coeff of Variation |
Min |
Q1 |
Median |
Q3 |
90th |
95th |
99th |
Max |
|---|---|---|---|---|---|---|---|---|---|---|---|---|---|
| 65 | 23.5 | 1.1 | 25.4 | 9.1 | 0.386 | 11.5 | 18.8 | 21.5 | 26.8 | 31.4 | 38.2 | 70.5 | 70.5 |
About These Tables:
These tables show the overall occurrence of lead in surface samples as described by USGS.
Sources of These Data:
The U.S. Geological Survey provided the soil sampling data. The data display was prepared by U.S. Environmental Protection Agency. Revision Date:
Charts
About These Charts:
These charts show the overall occurrence of lead in surface samples as described by USGS.
Sources of These Data:
The U.S. Geological Survey provided the soil sampling data. The data display was prepared by U.S. Environmental Protection Agency. Revision Date:
Texas State Data
Tables
Geogenic Soil Lead Concentrations (mg/kg): 2007-2010 (All Data)
| Number of Samples |
Mean |
Std Error |
95 UCL |
Std Dev |
Coeff of Variation |
Min |
Q1 |
Median |
Q3 |
90th |
95th |
99th |
Max |
|---|---|---|---|---|---|---|---|---|---|---|---|---|---|
| 431 | 16.1 | 0.6 | 17.0 | 11.5 | 0.715 | 3.1 | 10.7 | 14.2 | 18.7 | 23.3 | 27.8 | 69.4 | 142.0 |
Geogenic Soil Lead Concentrations (mg/kg): 2007-2010 (Outliers Excluded)
| Number of Samples |
Mean |
Std Error |
95 UCL |
Std Dev |
Coeff of Variation |
Min |
Q1 |
Median |
Q3 |
90th |
95th |
99th |
Max |
|---|---|---|---|---|---|---|---|---|---|---|---|---|---|
| 425 | 15.0 | 0.3 | 15.5 | 6.1 | 0.406 | 3.1 | 10.6 | 14.1 | 18.3 | 23.0 | 25.7 | 36.5 | 40.3 |
About These Tables:
These tables show the overall occurrence of lead in surface samples as described by USGS.
Sources of These Data:
The U.S. Geological Survey provided the soil sampling data. The data display was prepared by U.S. Environmental Protection Agency. Revision Date:
Charts
About These Charts:
These charts show the overall occurrence of lead in surface samples as described by USGS.
Sources of These Data:
The U.S. Geological Survey provided the soil sampling data. The data display was prepared by U.S. Environmental Protection Agency. Revision Date:
Utah State Data
Tables
Geogenic Soil Lead Concentrations (mg/kg): 2007-2010 (All Data)
| Number of Samples |
Mean |
Std Error |
95 UCL |
Std Dev |
Coeff of Variation |
Min |
Q1 |
Median |
Q3 |
90th |
95th |
99th |
Max |
|---|---|---|---|---|---|---|---|---|---|---|---|---|---|
| 131 | 18.7 | 1.2 | 20.6 | 13.4 | 0.716 | 0.9 | 13.0 | 14.9 | 22.3 | 28.9 | 35.7 | 66.1 | 133.0 |
Geogenic Soil Lead Concentrations (mg/kg): 2007-2010 (Outliers Excluded)
| Number of Samples |
Mean |
Std Error |
95 UCL |
Std Dev |
Coeff of Variation |
Min |
Q1 |
Median |
Q3 |
90th |
95th |
99th |
Max |
|---|---|---|---|---|---|---|---|---|---|---|---|---|---|
| 129 | 17.4 | 0.7 | 18.5 | 7.8 | 0.445 | 0.9 | 13.0 | 14.8 | 21.5 | 28.3 | 33.8 | 44.2 | 46.1 |
About These Tables:
These tables show the overall occurrence of lead in surface samples as described by USGS.
Sources of These Data:
The U.S. Geological Survey provided the soil sampling data. The data display was prepared by U.S. Environmental Protection Agency. Revision Date
Charts
About These Charts:
These charts show the overall occurrence of lead in surface samples as described by USGS.
Sources of These Data:
The U.S. Geological Survey provided the soil sampling data. The data display was prepared by U.S. Environmental Protection Agency. Revision Date:
Vermont State Data
Tables
Geogenic Soil Lead Concentrations (mg/kg): 2007-2010 (All Data)
| Number of Samples |
Mean |
Std Error |
95 UCL |
Std Dev |
Coeff of Variation |
Min |
Q1 |
Median |
Q3 |
90th |
95th |
99th |
Max |
|---|---|---|---|---|---|---|---|---|---|---|---|---|---|
| 15 | 36.6 | 4.8 | 45.0 | 18.4 | 0.502 | 11.8 | 25.3 | 31.7 | 53.2 | 64.0 | 68.6 | 68.6 | 68.6 |
Geogenic Soil Lead Concentrations (mg/kg): 2007-2010 (Outliers Excluded)
| Number of Samples |
Mean |
Std Error |
95 UCL |
Std Dev |
Coeff of Variation |
Min |
Q1 |
Median |
Q3 |
90th |
95th |
99th |
Max |
|---|---|---|---|---|---|---|---|---|---|---|---|---|---|
| 15 | 36.6 | 4.8 | 45.0 | 18.4 | 0.502 | 11.8 | 25.3 | 31.7 | 53.2 | 64.0 | 68.6 | 68.6 | 68.6 |
About These Tables:
These tables show the overall occurrence of lead in surface samples as described by USGS.
Sources of These Data:
The U.S. Geological Survey provided the soil sampling data. The data display was prepared by U.S. Environmental Protection Agency. Revision Date:
Charts
About These Charts:
These charts show the overall occurrence of lead in surface samples as described by USGS.
Sources of These Data:
The U.S. Geological Survey provided the soil sampling data. The data display was prepared by U.S. Environmental Protection Agency. Revision Date:
Virginia State Data
Tables
Geogenic Soil Lead Concentrations (mg/kg): 2007-2010 (All Data)
| Number of Samples |
Mean |
Std Error |
95 UCL |
Std Dev |
Coeff of Variation |
Min |
Q1 |
Median |
Q3 |
90th |
95th |
99th |
Max |
|---|---|---|---|---|---|---|---|---|---|---|---|---|---|
| 66 | 29.0 | 2.1 | 32.5 | 17.0 | 0.587 | 9.8 | 17.0 | 25.0 | 35.2 | 51.9 | 56.8 | 87.3 | 87.3 |
Geogenic Soil Lead Concentrations (mg/kg): 2007-2010 (Outliers Excluded)
| Number of Samples |
Mean |
Std Error |
95 UCL |
Std Dev |
Coeff of Variation |
Min |
Q1 |
Median |
Q3 |
90th |
95th |
99th |
Max |
|---|---|---|---|---|---|---|---|---|---|---|---|---|---|
| 64 | 27.2 | 1.8 | 30.2 | 14.0 | 0.515 | 9.8 | 16.9 | 24.2 | 34.6 | 47.5 | 53.3 | 75.3 | 75.3 |
About These Tables:
These tables show the overall occurrence of lead in surface samples as described by USGS.
Sources of These Data:
The U.S. Geological Survey provided the soil sampling data. The data display was prepared by U.S. Environmental Protection Agency. Revision Date
Charts
About These Charts:
These charts show the overall occurrence of lead in surface samples as described by USGS.
Sources of These Data:
The U.S. Geological Survey provided the soil sampling data. The data display was prepared by U.S. Environmental Protection Agency. Revision Date:
Washington State Data
Tables
Geogenic Soil Lead Concentrations (mg/kg): 2007-2010 (All Data)
| Number of Samples |
Mean |
Std Error |
95 UCL |
Std Dev |
Coeff of Variation |
Min |
Q1 |
Median |
Q3 |
90th |
95th |
99th |
Max |
|---|---|---|---|---|---|---|---|---|---|---|---|---|---|
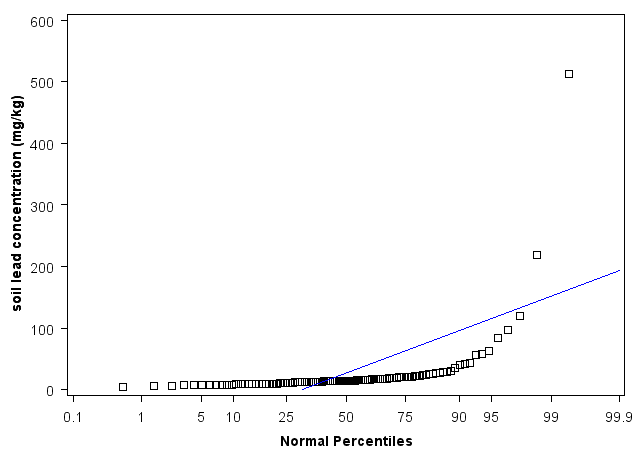
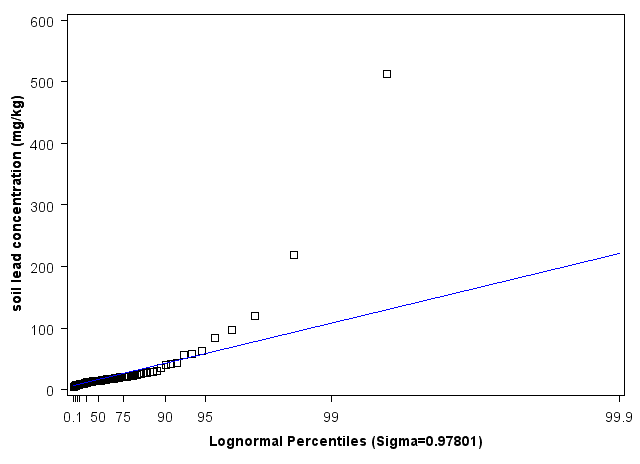
| 109 | 48.9 | 22.8 | 86.7 | 238.2 | 4.874 | 6.1 | 12.1 | 15.5 | 22.2 | 42.1 | 84.1 | 513.0 | 2450.0 |
Geogenic Soil Lead Concentrations (mg/kg): 2007-2010 (Outliers Excluded)
| Number of Samples |
Mean |
Std Error |
95 UCL |
Std Dev |
Coeff of Variation |
Min |
Q1 |
Median |
Q3 |
90th |
95th |
99th |
Max |
|---|---|---|---|---|---|---|---|---|---|---|---|---|---|
| 108 | 26.6 | 5.2 | 35.2 | 53.8 | 2.019 | 6.1 | 12.0 | 15.5 | 22.1 | 40.6 | 63.3 | 219.0 | 513.0 |
About These Tables:
These tables show the overall occurrence of lead in surface samples as described by USGS.
Sources of These Data:
The U.S. Geological Survey provided the soil sampling data. The data display was prepared by U.S. Environmental Protection Agency. Revision Date
Charts
About These Charts:
These charts show the overall occurrence of lead in surface samples as described by USGS.
Sources of These Data:
The U.S. Geological Survey provided the soil sampling data. The data display was prepared by U.S. Environmental Protection Agency. Revision Date:
West Virginia State Data
Tables
Geogenic Soil Lead Concentrations (mg/kg): 2007-2010 (All Data)
| Number of Samples |
Mean |
Std Error |
95 UCL |
Std Dev |
Coeff of Variation |
Min |
Q1 |
Median |
Q3 |
90th |
95th |
99th |
Max |
|---|---|---|---|---|---|---|---|---|---|---|---|---|---|
| 39 | 31.4 | 1.6 | 34.1 | 10.1 | 0.321 | 14.1 | 27.6 | 31.3 | 36.5 | 42.2 | 53.5 | 61.2 | 61.2 |
Geogenic Soil Lead Concentrations (mg/kg): 2007-2010 (Outliers Excluded)
| Number of Samples |
Mean |
Std Error |
95 UCL |
Std Dev |
Coeff of Variation |
Min |
Q1 |
Median |
Q3 |
90th |
95th |
99th |
Max |
|---|---|---|---|---|---|---|---|---|---|---|---|---|---|
| 39 | 31.4 | 1.6 | 34.1 | 10.1 | 0.321 | 14.1 | 27.6 | 31.3 | 36.5 | 42.2 | 53.5 | 61.2 | 61.2 |
About These Tables:
These tables show the overall occurrence of lead in surface samples as described by USGS.
Sources of These Data:
The U.S. Geological Survey provided the soil sampling data. The data display was prepared by U.S. Environmental Protection Agency. Revision Date
Charts
About These Charts:
These charts show the overall occurrence of lead in surface samples as described by USGS.
Sources of These Data:
The U.S. Geological Survey provided the soil sampling data. The data display was prepared by U.S. Environmental Protection Agency. Revision Date:
Wisconsin State Data
Tables
Geogenic Soil Lead Concentrations (mg/kg): 2007-2010 (All Data)
| Number of Samples |
Mean |
Std Error |
95 UCL |
Std Dev |
Coeff of Variation |
Min |
Q1 |
Median |
Q3 |
90th |
95th |
99th |
Max |
|---|---|---|---|---|---|---|---|---|---|---|---|---|---|
| 88 | 19.3 | 1.8 | 22.4 | 17.0 | 0.879 | 3.9 | 12.5 | 16.4 | 21.7 | 27.4 | 34.2 | 154.0 | 154.0 |
Geogenic Soil Lead Concentrations (mg/kg): 2007-2010 (Outliers Excluded)
| Number of Samples |
Mean |
Std Error |
95 UCL |
Std Dev |
Coeff of Variation |
Min |
Q1 |
Median |
Q3 |
90th |
95th |
99th |
Max |
|---|---|---|---|---|---|---|---|---|---|---|---|---|---|
| 87 | 17.8 | 1.0 | 19.4 | 8.9 | 0.501 | 3.9 | 12.3 | 16.4 | 21.7 | 26.1 | 30.1 | 67.2 | 67.2 |
About These Tables:
These tables show the overall occurrence of lead in surface samples as described by USGS.
Sources of These Data:
The U.S. Geological Survey provided the soil sampling data. The data display was prepared by U.S. Environmental Protection Agency. Revision Date:
Charts
About These Charts:
These charts show the overall occurrence of lead in surface samples as described by USGS.
Sources of These Data:
The U.S. Geological Survey provided the soil sampling data. The data display was prepared by U.S. Environmental Protection Agency. Revision Date:
Wyoming State Data
Tables
Geogenic Soil Lead Concentrations (mg/kg): 2007-2010 (All Data)
| Number of Samples |
Mean |
Std Error |
95 UCL |
Std Dev |
Coeff of Variation |
Min |
Q1 |
Median |
Q3 |
90th |
95th |
99th |
Max |
|---|---|---|---|---|---|---|---|---|---|---|---|---|---|
| 161 | 18.9 | 0.4 | 19.6 | 5.1 | 0.269 | 4.3 | 15.7 | 18.1 | 20.7 | 25.0 | 28.8 | 38.0 | 38.6 |
Geogenic Soil Lead Concentrations (mg/kg): 2007-2010 (Outliers Excluded)
| Number of Samples |
Mean |
Std Error |
95 UCL |
Std Dev |
Coeff of Variation |
Min |
Q1 |
Median |
Q3 |
90th |
95th |
99th |
Max |
|---|---|---|---|---|---|---|---|---|---|---|---|---|---|
| 158 | 18.5 | 0.4 | 19.1 | 4.4 | 0.240 | 4.3 | 15.6 | 18.0 | 20.4 | 23.9 | 26.5 | 33.1 | 33.5 |
About These Tables:
These tables show the overall occurrence of lead in surface samples as described by USGS.
Sources of These Data:
The U.S. Geological Survey provided the soil sampling data. The data display was prepared by U.S. Environmental Protection Agency. Revision Date:
Charts
About These Charts:
These charts show the overall occurrence of lead in surface samples as described by USGS.
Sources of These Data:
The U.S. Geological Survey provided the soil sampling data. The data display was prepared by U.S. Environmental Protection Agency. Revision Date: