U.S. flag

An official website of the United States government

Here’s how you know

Dot gov

Official websites use .gov
A .gov website belongs to an official government organization in the United States.

HTTPS

Secure .gov websites use HTTPS
A lock (LockA locked padlock) or https:// means you’ve safely connected to the .gov website. Share sensitive information only on official, secure websites.

    • Environmental Topics
    • Air
    • Bed Bugs
    • Cancer
    • Chemicals, Toxics, and Pesticide
    • Emergency Response
    • Environmental Information by Location
    • Health
    • Land, Waste, and Cleanup
    • Lead
    • Mold
    • Radon
    • Research
    • Science Topics
    • Water Topics
    • A-Z Topic Index
    • Laws & Regulations
    • By Business Sector
    • By Topic
    • Compliance
    • Enforcement
    • Laws and Executive Orders
    • Regulations
    • Report a Violation
    • Environmental Violations
    • Fraud, Waste or Abuse
    • About EPA
    • Our Mission and What We Do
    • Headquarters Offices
    • Regional Offices
    • Labs and Research Centers
    • Planning, Budget, and Results
    • Organization Chart
    • EPA History

Breadcrumb

  1. Home
  2. Causal Analysis/Diagnosis Decision Information System (CADDIS)

Conditional Probability Analysis: EPT Taxa Richness < 18 vs. Turbidity in Oregon Coastal Streams
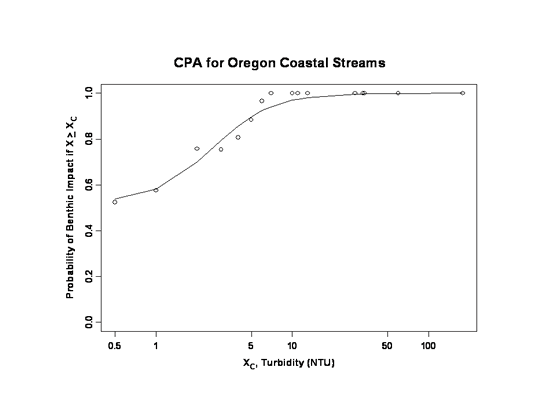
CPA for Oregon Coastal Streams
 
Helpful Links

On this Page

  • Plot
  • Model
  • Data Analysis
  • Data Origin
  • Sampling Design
  • Contact

Back to: Field Stressor-Response Association Gallery

Plot

  1. Analysis: Conditional probability analysis
  2. Independent variable: Turbidity (NTU)
  3. Dependent variable: Probability of unacceptable condition for EPA taxa richness at < 18
  4. Key: symbols = observations, solid line: nonlinear curve fit of logistic-like function with change in slope.
  5. Sample size: n = 49

Model

  1. Conditional probability analysis does not produce model parameters. Rather, it plots the probabilities of observing the stated impairment (i.e. item 3 in the list above) over a stressor intensity gradient.
  2. Date: 8 November 2006

Data Analysis

  1. Program: S-Plus Version 7.0, user written scripts, variable weighting for site data

Data Origin

  1. Agency: U.S. Environmental Protection Agency
  2. Program: Environmental Monitoring and Assessment Program (EMAP), Regional EMAP (REMAP)
  3. Project: REMAP Region 10 Washington/Oregon Coastal Streams and Yakima River Basin Streams Project
  4. Location: Washington & Oregon coastal and Yakima River Basin
  5. Environmental Monitoring and Assessment Program (EMAP) data and metadata.

Sampling Design

  1. Data collected 1994 through 1995.
  2. Chaloud, D.J. and D.V. Peck. 1994. Environmental Monitoring and Assessment Program - Surface Waters: Integrated Quality Assurance Project Plan for the Surface Waters Resource Group, 1994 Activities. EPA 600/X-91/080, Rev. 2.00. U.S. Environmental Protection Agency, Office of Research and Development, Las Vegas, NV 89193.
  3. Hayslip, G. A. (editor). 1993. EPA Region 10 In-stream Biological Monitoring Handbook (for wadeable streams in the Pacific Northwest). EPA-910/9-92-013. U. S. Environmental Protection Agency - Region 10, Environmental Services Division, Seattle, WA 98101.
  4. Catalog Documentation for REMAP Region 10. 1994-1995 Washington/Oregon Coastal Streams and Yakima River Basin Streams Project Data.

Contact

John F. Paul, paul.john@epa.gov, (919) 541-3160

Causal Analysis/Diagnosis Decision Information System (CADDIS)

  • CADDIS Home
    • About CADDIS
    • Frequent Questions
    • Publications
    • Recent Additions
    • Related Links
    • CADDIS Glossary
  • Volume 1: Stressor Identification
    • About Causal Assessment
    • Getting Started
    • Step 1. Define the Case
    • Step 2. List Candidate Causes
    • Step 3. Evaluate Data from the Case
    • Step 4. Evaluate Data from Elsewhere
    • Step 5. Identify Probable Causes
  • Volume 2: Sources, Stressors and Responses
    • About Sources
      • Urbanization
    • About Stressors
  • Volume 3: Examples and Applications
    • Analytical Examples
    • Worksheet Examples
    • State Examples
    • Case Studies
    • Galleries
  • Volume 4: Data Analysis
    • Selecting an Analysis Approach
    • Getting Started
    • Basic Principles & Issues
    • Exploratory Data Analysis
    • Basic Analyses
    • Advanced Analyses
    • PECBO Appendix
    • Download Software
    • Data Analysis Topics (A -Z)
  • Volume 5: Causal Databases
    • Learn about CADLink
Contact Us about CADDIS
Contact Us to ask a question, provide feedback, or report a problem.
Last updated on February 7, 2025
  • Assistance
  • Spanish
  • Arabic
  • Chinese (simplified)
  • Chinese (traditional)
  • French
  • Haitian Creole
  • Korean
  • Portuguese
  • Russian
  • Tagalog
  • Vietnamese
United States Environmental Protection Agency

Discover.

  • Accessibility Statement
  • Budget & Performance
  • Contracting
  • EPA www Web Snapshot
  • Grants
  • No FEAR Act Data
  • Plain Writing
  • Privacy
  • Privacy and Security Notice

Connect.

  • Data
  • Inspector General
  • Jobs
  • Newsroom
  • Regulations.gov
  • Subscribe
  • USA.gov
  • White House

Ask.

  • Contact EPA
  • EPA Disclaimers
  • Hotlines
  • FOIA Requests
  • Frequent Questions
  • Site Feedback

Follow.