
Galleries
Overview
This section provides examples of stressor-response associations and species sensitivity distributions for common stressors. The underlying statistical methods for estimating these relationships are described in more detail in Data Analysis (volume 4).
Examples shown here may apply directly to your causal analysis, provided the data are comparable. Three (3) galleries currently are available:
- Metals Chronic Concentration-Response Gallery - this example contains plots and source data describing aquatic organism responses to chronic metal exposures.
- Metals Species Sensitivity Distribution (SSD) Gallery - this example contains SSD plots and source data for a range of toxic metals.
- Field Stressor-Response Association Gallery - this one contains plots of stressor-response relationships (primarily for sediment and metals) computed from field data.
Metals Chronic Concentration-Response Gallery
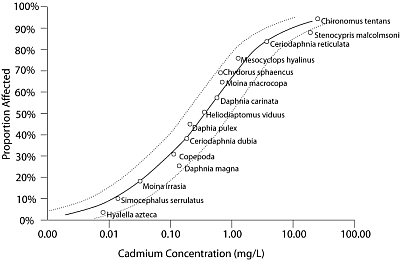
The Metals Chronic Concentration-Response Gallery is a gallery of plots and source data describing the responses of aquatic organisms to chronic exposures to metals (e.g., arsenic, cadmium, chromium, copper, lead, mercury, nickel, selenium and zinc). These data are particularly valuable because they include longer term exposures, multiple life stages and sublethal as well as lethal effects. Results are presented as fitted functions and concentrations resulting in prescribed proportions affected (EC5, EC10, EC20 and EC50). Confidence intervals may be found in the Model Parameters and Benchmarks worksheets.
What Are the Source Data For These Plots?
The data used for these plots were extracted from toxicity test results originally published between 1968 and 1996. The tests selected were judged to be suitable for deriving national ambient water quality criteria by the database developers, David Hansen and Glenn Thursby of the U.S. EPA National Health and Environmental Effects Research Laboratory in Narragansett, RI. The version of the data base used here was quality assured, edited, and published in U.S. EPA (2005). See references (Kerr and Meador 1996).
How Were Plots Generated?
Plots were successfully modeled for 38 of the 120 datasets using the method described by Kerr and Meador (1996). Confidence intervals were calculated for both the exposure concentration (red dashed lines, Figure 1) and the proportion responding (blue dashed lines, Figure 1). Some papers reported only mean responses without standard deviations or results for replicates. For these sets, surrogate standard deviations were derived based on the expected variance for that type of response (see U.S. EPA 2005). Linear interpolation was also used to estimate the EC5, EC10, EC20 and EC50 benchmark values for those datasets exhibiting both a concentration-response relationship and sufficient data points (Figure 1, right). See U.S. EPA (2005) for more detail on the methods.
Download and Browse the Gallery
- Save to your computer the Metal Chronic Concentration Response Gallery - V1 (zip) .
- Unzip the file by right clicking on the folder and selecting "extract all" to invoke the extraction wizard.
- Open the file titled "Start Here - Chronic Metals Concentration Response Gallery V1.xls"
- Enable macros and open as "read only" (if you wish to modify this file, open as read only, make your changes, then save it under a different name).
- Review the background information before selecting the plots and source data of interest using the Browse the Chronic Metals Gallery worksheet.
Metals Species Sensitivity Distribution (SSD) Gallery
Where Are The Source Data For These Plots?
What If I Want To Modify An SSD For Use In My Causal Analysis?
Download and Browse the Gallery
- Save to your computer the Metals SSD Gallery - V1 (zip) .
-
Unzip the file by right clicking on the folder and selecting "extract all" to invoke the extraction wizard.
- Open the file titled Start Here - Metals SSD Gallery - V1.xls
- Locate the plots and source data of interest using the Browse the Metals SSD Gallery worksheet.
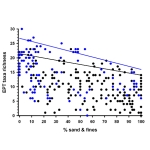
Field Stressor-Response Association Gallery
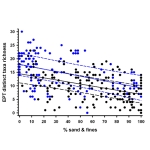
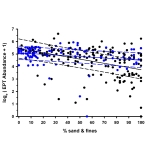
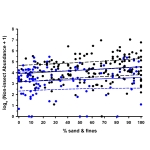
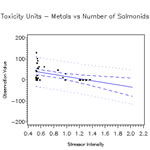
The Field Stressor-Response Association Gallery provides examples of stressor-response relationships computed from field data. They illustrate stressor-response relationships that have been observed in several datasets, using some of the methods described in Volume 4: Data Analysis. We recommend that you review the description of the analytical methods prior to viewing or using the graphs.
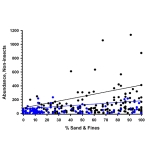
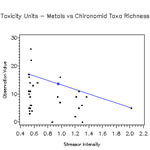
These plots illustrate the types of relationships that may be found between some common stressors and biological responses. However, it is unlikely that the stressor-response relationships shown here will be exactly applicable to your particular situation. Please review the metadata provided with each graph carefully: examine whether the sampling and analysis methods are comparable, and evaluate whether the response and explanatory variables are relevant to your aquatic system and causal analysis.
Click on each thumbnail to see a larger version of the image(s) and the related metadata.
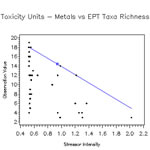
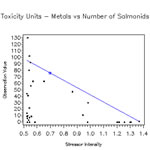
Regression Analysis
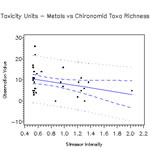
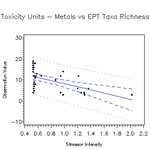
Quantile Regression
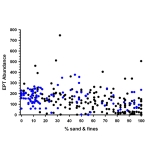
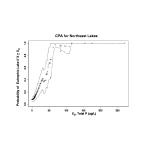
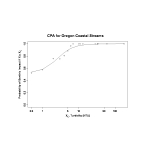
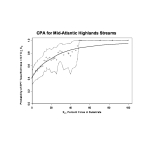
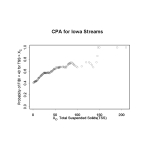
Conditional Probability Analysis
References
- Kerr DR, Meador JP (1996) Modeling dose response using generalized linear models. Environmental Toxicology and Chemistry 15(3):395-401.
- Kutner MH, Nachtsheim CJ, Neter J, Li W (2005) Applied Linear Statistical Models (5th edition). McGraw-Hill/Irwin.
- Sokal RR, Rohlf FJ (1995) Biometry (3rd edition). Freeman, New York NY.
- U.S. EPA (2005) Methods/Indicators for Determining when Metals are the Cause of Biological Impairments of Rivers and Streams: Species Sensitivity Distributions and Chronic Exposure-Response Relationships from Laboratory Data. U.S. Environmental Protection Agency, Office of Research and Development, Washington DC. EPA/600/X-05/027.