
State Examples
Causal analysis has been useful in several applications where environmental decision-making required establishment of cause-effect relationships in both state and other regulatory examples. Use the tabs to explore these examples in more detail.
Applications to the Clean Water Act 303d/Total Maximum Daily Load (TMDL) Program
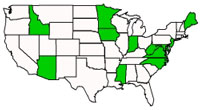
| State | Example of Stressor Identification Use |
|---|---|
| Arizona | Biocriteria Implementation Procedures |
| Idaho | Hellroaring Creek Stressor Identification |
| Indiana | Stressor Identification Process for the Limberlost Watershed (Morris et al. 2006) |
| Iowa | Total Maximum Daily Load For Sediment and Nutrients Camp Creek Polk County, Iowa |
| Maine | Urban Streams Project Report |
| Maryland | TMDL Elements to Review Prior to Implementation Planning |
| Minnesota | 2007 Guidance Manual for Assessing the Quality of Minnesota Surface Waters for the Determination of Impairment |
| Mississippi | Phase 1 Total Maximum Daily Load Organic Enrichment/Low Dissolved Oxygen and Ammonia Nitrogen Little Tangipahoa River South Independent Basin |
| New Jersey | The Use of Benthic Macroinvertebrate Assessments in the Stressor Identification Process to Reduce Chemical Analytical Costs |
| North Carolina | DRAFT Total Maximum Daily Load for Addressing Impaired Biological Integrity in the Headwaters of Swift Creek Watershed, Neuse River Basin |
| Virginia | Benthic TMDL Development: Stressor Identification for the Jackson River, Virginia; Potomac/Shenandoah River Fish Kill |
Derivation of Water Quality Criteria
Controlled laboratory tests have provided exposure-response relationships for U.S. EPA’s ambient water quality criteria. Some stressors, however, are not easily tested in the laboratory. A weight of evidence approach similar to Stressor Identification may aid criteria development. These criteria can be based on observed field associations between exposure and effects. This approach has been applied to suspended and bedded sediment (U.S. EPA 2006).
Hazardous Waste Site Assessments
Environmental assessments for Superfund, the Oil Pollution Act, and other legislation that address environmental wastes have traditionally followed conventional risk assessment frameworks. They characterize contaminants and use laboratory toxicity data to estimate the risks posed to humans and nonhumans.
Assessors are increasingly using biological surveys to identify impairments and causal inference to determine impairment causes. These eco-epidemiological assessments might improve contaminated site assessments, as illustrated by two demonstration assessments:
- Elk Hills, CA (terrestrial) case study
- California Gulch, CO record of decision
Endangered Species Act
Assessments of the viability of threatened and endangered species can protect those species' futures. Historically, these assessments have focused on habitat loss and degradation. San Joaquin kit fox declines in Elk Hills, CA spurred once such case study.
- Elk Hills, CA (terrestrial) case study
The assessment was undertaken to determine if oil field contaminants caused a multi-year population decline. Habitat alteration, climate, prey abundance, disease, contaminants and predation were the causes evaluated. Predation was found to have caused the population decline. However, predator (coyote) abundance appeared to have increased in response to oil development.
References
- Allan JD (2004) Landscapes and riverscapes: the influence of land use on stream ecosystems. Annual Review of Ecology and Systematics 35:257-284.
- Morris CC, Simon TP, Newhouse SA (2006) A local-scale in situ approach for stressor identification of biologically impaired aquatic systems. Archives of Environmental Contamination and Toxicology 50(3):325-334.
- U.S. EPA (2006) Framework for Developing Suspended and Bedded Sediments (SABS) Water Quality Criteria. U.S. Environmental Protection Agency, Washington DC. EPA-822-R-06-001.