U.S. flag

An official website of the United States government

Here’s how you know

Dot gov

Official websites use .gov
A .gov website belongs to an official government organization in the United States.

HTTPS

Secure .gov websites use HTTPS
A lock (LockA locked padlock) or https:// means you’ve safely connected to the .gov website. Share sensitive information only on official, secure websites.

    • Environmental Topics
    • Air
    • Bed Bugs
    • Cancer
    • Chemicals, Toxics, and Pesticide
    • Emergency Response
    • Environmental Information by Location
    • Health
    • Land, Waste, and Cleanup
    • Lead
    • Mold
    • Radon
    • Research
    • Science Topics
    • Water Topics
    • A-Z Topic Index
    • Laws & Regulations
    • By Business Sector
    • By Topic
    • Compliance
    • Enforcement
    • Laws and Executive Orders
    • Regulations
    • Report a Violation
    • Environmental Violations
    • Fraud, Waste or Abuse
    • About EPA
    • Our Mission and What We Do
    • Headquarters Offices
    • Regional Offices
    • Labs and Research Centers
    • Planning, Budget, and Results
    • Organization Chart
    • EPA History

Breadcrumb

  1. Home
  2. Causal Analysis/Diagnosis Decision Information System (CADDIS)

Basic Analyses

  • Tests
  • Regression Analysis
  • Quantile Regression
  • CART Analysis
  • References

Additional Information on Classification and Regression Tree (CART) Analysis

Helpful Links
On This Page 
  • Using CART analysis in causal analysis
  • Assumptions in CART Analysis
  • Simplification or “Pruning” of Classification and Regression Trees
Other Pages And Websites
  • Controlling for Natural Variation
  • Confounding 

Back to: CART Analysis


Authors

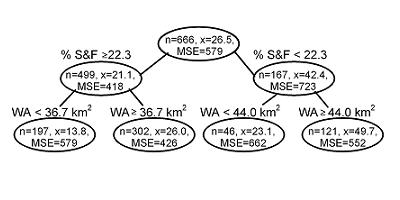
Classification and regression tree (CART) analysis recursively partitions observations in a matched data set, consisting of a categorical (for classification trees) or continuous (for regression trees) dependent (response) variable and one or more independent (explanatory) variables, into progressively smaller groups (De’ath and Fabricius 2000, Prasad et al. 2006).  Each partition is a binary split. During each recursion, splits for each explanatory variable are examined and the split that maximizes the homogeneity of the two resulting groups with respect to the dependent variable is chosen. A typical output from these analyses is shown below (in Figure 1).

Figure 1. A tree diagram for relative abundance of lithophilous fish (i.e., fish that broadcast spawn on gravel beds) with respect to % sand and fines (% S&F, a measure of fine bedded sediment) and watershed area (WA).
Figure 1. A tree diagram for relative abundance of lithophilous fish (i.e., fish that broadcast spawn on gravel beds) with respect to % sand and fines (% S&F, a measure of fine bedded sediment) and watershed area (WA). Branches are annotated showing the decision rules (e.g. % sand and fines < 22.3). Nodes are annotated showing the mean of the dependent variable (n = number of observations, x = mean value, MSE = mean squared error). Data set provided by the Minnesota Pollution Control Agency.

Using CART Analysis in Causal Analysis

CART analysis is used in data exploration to classify systems that differ due to natural causes. CART analysis may be used to determine the relative importance of different variables for identifying homogeneous groups within the data set.

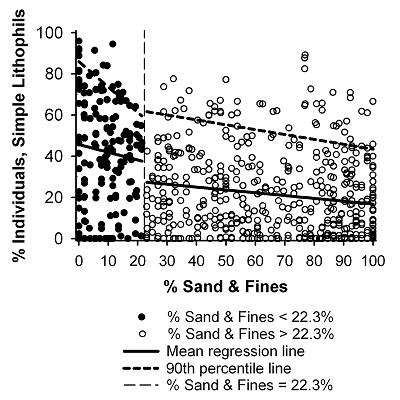
In Figure 1, the CART analysis results suggest that the relationship between the relative abundance of lithophilous fish and % sand and fines depends on watershed area. Based on this finding, one might consider classifying these sites based on drainage area into sites greater than or less than about 40 km2.

CART analyses also might be used to help identify variables that may confound estimates of stressor-response relationships.

Figure 2. Scatterplot of % sand and fines and % of lithophilous fish.
Figure 2. Scatterplot of % sand and fines and % of lithophilous fish. Based on the CART analysis depicted in Figure M.8-1, observations with % sand and fines < 22.3% are plotted as closed circles, and observations with % sand and fines > 22.3 % are plotted as open circles. Linear regression (solid lines) and 90th-percentile quantile regression (dashed lines) reveal different slopes and intercepts for the two categories.
CART analysis also can help describe stressor-response relationships by identifying the levels of the stressor at which its functional relationship with the biological response might change. This application may be used to help identify inflection points or nonlinearities in a stressor-response relationship (Brenden et al. 2008). Apparent change points then can be investigated using other techniques (e.g., regression analysis) to determine whether they represent thresholds or other change points in the stressor-response relationship. For example, the previous CART analysis (in Figure 1) identified a split in the data set at % sand and fines = 22.3%. Regression analyses demonstrate that two groups are best described by different models: the y intercepts of the mean regression line and both the intercept and slope of the 90th-percentile line decreased for sites where the percentage of sand and fines exceeded 22.3% (in Figure 2). After the model is derived, it would be interpreted in the same way as the results from regression or quantile regression analyses.

Assumptions in Classification and Regression Tree Analysis (CART)

Unlike linear regression techniques, CART analysis does not assume a particular form of relationship between the independent and dependent variables. Therefore, CART can often be used even in cases where data are not suitable for analysis by linear regression. The objective of CART analysis is to create a decision tree that predicts the characteristics of the population of sites being studied. Therefore, the more sites (i.e., examples or observations) presented to the algorithm, the more accurately it will predict the characteristics of the population.

Simplification or “Pruning” of Classification and Regression Trees

Theoretically, CART algorithms could continue to split a data set until there are groups or nodes containing every observation in the data set.  In causal analysis, one is generally most interested in the first few splits of a data set.  Moreover, to avoid such overfitting of the data, algorithms used in CART generally simplify or “prune” the tree that contains all possible splits of the data to an optimal tree that contains a sufficient number of splits to describe the data.

Many algorithms use stopping criteria that may set the minimum number of observations needed in a group or node in order to split that group, the minimum number of observations needed in a terminal group or node in order to retain that group, or the minimum decrease in the overall lack of fit (i.e., usually the mean squared error) needed for a split of a group or node in order to retain that split.  These stopping criteria usually have default values, but they can be set by the user.  As some of these criteria are based on the number of observations in a group or node, the number of splits will be dependent on the total number of observations in a data set.

Other options for pruning trees include the use of cross-validation, where the CART analysis is conducted iteratively on random subsets of the data set, or validation of the resulting tree against a second, independent data set.  As a result, finding a final tree is a balance between model fit and the size of the data set available for analysis.

Causal Analysis/Diagnosis Decision Information System (CADDIS)

  • CADDIS Home
    • About CADDIS
    • Frequent Questions
    • Publications
    • Recent Additions
    • Related Links
    • CADDIS Glossary
  • Volume 1: Stressor Identification
    • About Causal Assessment
    • Getting Started
    • Step 1. Define the Case
    • Step 2. List Candidate Causes
    • Step 3. Evaluate Data from the Case
    • Step 4. Evaluate Data from Elsewhere
    • Step 5. Identify Probable Causes
  • Volume 2: Sources, Stressors and Responses
    • About Sources
      • Urbanization
    • About Stressors
  • Volume 3: Examples and Applications
    • Analytical Examples
    • Worksheet Examples
    • State Examples
    • Case Studies
    • Galleries
  • Volume 4: Data Analysis
    • Selecting an Analysis Approach
    • Getting Started
    • Basic Principles & Issues
    • Exploratory Data Analysis
    • Basic Analyses
    • Advanced Analyses
    • PECBO Appendix
    • Download Software
    • Data Analysis Topics (A -Z)
  • Volume 5: Causal Databases
    • Learn about CADLink
Contact Us about CADDIS
Contact Us to ask a question, provide feedback, or report a problem.
Last updated on February 7, 2025
  • Assistance
  • Spanish
  • Arabic
  • Chinese (simplified)
  • Chinese (traditional)
  • French
  • Haitian Creole
  • Korean
  • Portuguese
  • Russian
  • Tagalog
  • Vietnamese
United States Environmental Protection Agency

Discover.

  • Accessibility Statement
  • Budget & Performance
  • Contracting
  • EPA www Web Snapshot
  • Grants
  • No FEAR Act Data
  • Plain Writing
  • Privacy
  • Privacy and Security Notice

Connect.

  • Data
  • Inspector General
  • Jobs
  • Newsroom
  • Regulations.gov
  • Subscribe
  • USA.gov
  • White House

Ask.

  • Contact EPA
  • EPA Disclaimers
  • Hotlines
  • FOIA Requests
  • Frequent Questions
  • Site Feedback

Follow.