
Figures: Causal Pathway
Figure 3-5a. Causal Pathway, Supports
The impairment (dead fish) occurs downstream of the source of the precursor (phosphate) and high algal production is sufficient to cause high early morning respiration resulting in observed low dissolved oxygen (the causal agent). Turbulence, which might have aerated the water, is absent.
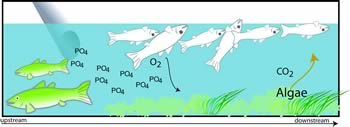
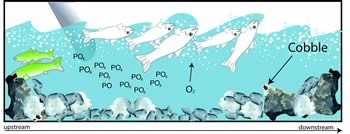
Figure 3-5b. Causal Pathway, Refutes
The impairment (dead fish) occurs downstream of the source of a precursor (phosphate) of the candidate causal agent (dissolved oxygen) but the proposed causal pathway is interrupted by turbulence which aerates the water, and the lack of periphyton on the cobble substrate confirms that there is no eutrophication, so another step is absent.
Explanation of the Types of Evidence Illustrations
This description applies to each of the types of evidence illustrations. These illustrations provide graphic explanations of the types of evidence. They are somewhat abstract to convey that they are representative of the concept rather than illustrations of particular applications. The live fish (green and upright) represent unimpaired organisms, populations or communities of all types, not just fish. The dead fish (white and belly-up at the surface) represent all biological impairments, not just dead fish. The pipe represents all sources and the yellow effluent plume represents all causal agents (stressors), not just effluents or even chemicals. Clock faces represent the passage of time, not the particular time difference illustrated. Fish in beakers represent laboratory tests. Other graphic elements used in particular illustrations are explained in the caption.