
Global Greenhouse Gas Overview
On This Page:
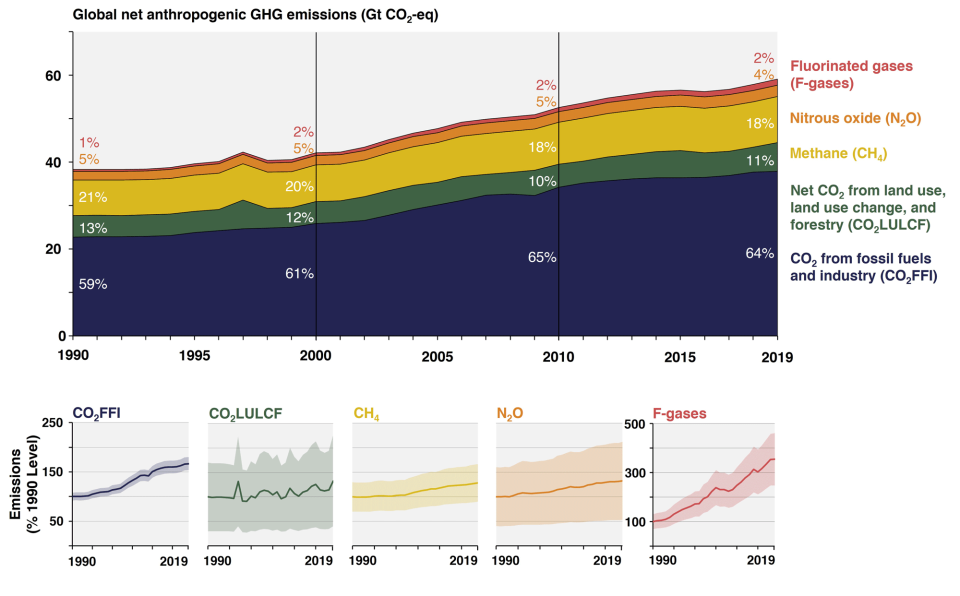
Global Emissions and Removals by Gas
At the global scale, the key greenhouse gases emitted by human activities are:
- Carbon dioxide (CO2): Fossil fuel use is the primary source of CO2. CO2 can also be emitted from the landscape through deforestation, land clearance for agriculture or development, and degradation of soils. Likewise, land management can also remove additional CO2 from the atmosphere through reforestation, improvement of soil health, and other activities.
- Methane (CH4): Agricultural activities, waste management, energy production and use, and biomass burning all contribute to CH4 emissions.
- Nitrous oxide (N2O): Agricultural activities, such as fertilizer use, are the primary source of N2O emissions. Chemical production and fossil fuel combustion also generates N2O.
- Fluorinated gases (F-gases): Industrial processes, refrigeration, and the use of a variety of consumer products contribute to emissions of F-gases, which include hydrofluorocarbons (HFCs), perfluorocarbons (PFCs), and sulfur hexafluoride (SF6).
Additional compounds in the atmosphere including solid and liquid aerosol and other greenhouse gases, such as water vapor and ground-level ozone can also impact the climate. Learn more about these compounds and climate change on our
Basics of Climate Change page.
- Other Greenhouse Gases:
- Ground-Level Ozone: Created by chemical reactions between nitrogen oxides and volatile organic compounds from automobiles, power plants, and other industrial and commercial sources in the presence of sunlight. Besides trapping heat, ground-level ozone is a pollutant that can cause respiratory health problems and damage crops and ecosystems.
- Water Vapor: Water vapor is another greenhouse gas and plays a key role in climate feedbacks because of its heat-trapping ability. Warmer air holds more moisture than cooler air. Therefore, as greenhouse gas concentrations increase and global temperatures rise, the total amount of water vapor in the atmosphere also increases, further amplifying the warming effect. Unlike the other greenhouse gases, water vapor can condense and rain out when it reaches high concentrations. Therefore, while human activities such as evaporation from irrigation and power plant cooling do release water vapor into the air, these activities have been determined to have a negligible effect on global climate (IPCC 2021).
- Aerosols: Aerosols are microscopic (solid or liquid) particles that are so small that instead of quickly falling to the surface like larger particles, they remain suspended in the air for days to weeks. Human activities, such as burning fossil fuels and biomass, contribute to emissions of these substances, although some aerosols also come from natural sources such as volcanoes and marine plankton. Unlike greenhouse gases, the climate effects of aerosols vary depending on what they are made of and where they are emitted. Depending on their color and other factors, aerosols can either absorb or reflect sunlight. Aerosols that reflect sunlight, such as particles from volcanic eruptions or sulfur emissions from burning coal, have a cooling effect. Those that absorb sunlight, such as black carbon (a part of soot), have a warming effect.
Global Emissions by Economic Sector
Global greenhouse gas emissions can also be broken down by the economic activities that lead to their atmospheric release.[1]
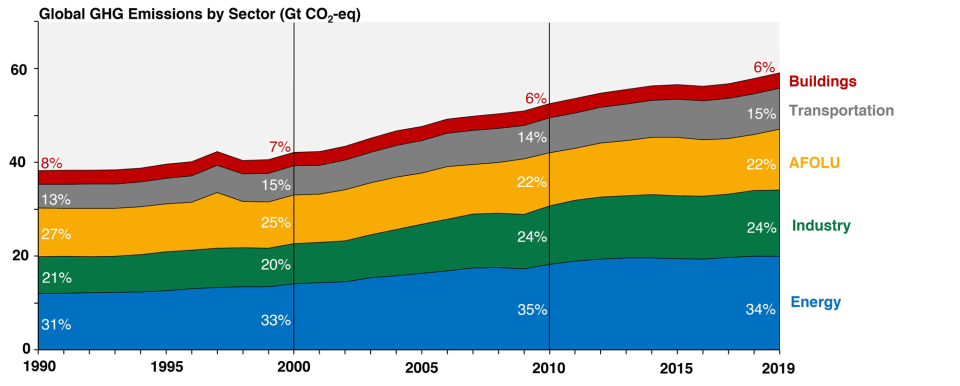
- Electricity and Heat Production (34% of 2019 global greenhouse gas emissions): The burning of coal, natural gas, and oil for electricity and heat is the largest single source of global greenhouse gas emissions.
- Industry (24% of 2019 global greenhouse gas emissions): Greenhouse gas emissions from industry primarily involve fossil fuels burned on site at facilities for energy. This sector also includes emissions from chemical, metallurgical, and mineral transformation processes not associated with energy consumption and emissions from waste management activities. (Note: Emissions from industrial electricity use are excluded and are instead covered in the Electricity and Heat Production sector.)
- Agriculture, Forestry, and Other Land Use (22% of 2019 global greenhouse gas emissions): Greenhouse gas emissions from this sector come mostly from agriculture (cultivation of crops and livestock) and deforestation. This estimate does not include the CO2 that ecosystems remove from the atmosphere by sequestering carbon (e.g. in biomass, soils).[2]
- Transportation (15% of 2019 global greenhouse gas emissions): Greenhouse gas emissions from this sector primarily involve fossil fuels burned for road, rail, air, and marine transportation. Almost all (95%) of the world's transportation energy comes from petroleum-based fuels, largely gasoline and diesel.[3]
- Buildings (6% of 2019 global greenhouse gas emissions): Greenhouse gas emissions from this sector arise from onsite energy generation and burning fuels for heat in buildings or cooking in homes. Note: Emissions from this sector are 16% when electricity use in buildings is included in this sector instead of the Energy sector.
Note on emissions sector categories.
Trends in Global Emissions
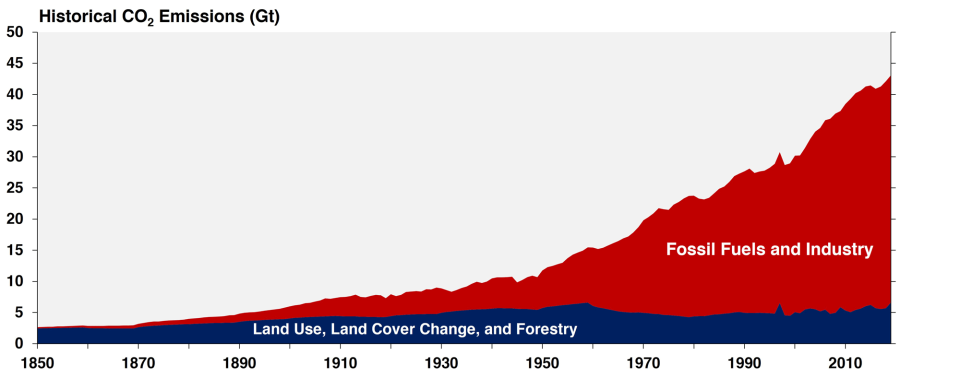
Emissions of non-CO2 greenhouse gases (CH4, N2O, and F-gases) have also increased significantly since 1850.
- Globally, greenhouse gas emissions continued to rise across all sectors and subsectors, most rapidly in the transport and industry sectors.
- While the trend in emissions continues to rise, annual greenhouse gas growth by sector slowed in 2010 to 2019, compared to 2000 to 2009, for energy and industry, however remained roughly stable for transport.
- The trend for for AFOLU remains more uncertain, due to the multitude of drivers that affect emissions and removals for land use, land-use change and forestry.
- Greenhouse gas emissions from industry, buildings and transport sectors are driven by
- rising demand for construction materials and manufactured products,
- increasing floor space per capita,
- increasing building energy use,
- travel distances, and vehicle size and weight.
To learn more about past and projected global emissions of non-CO2 gases, please see the EPA report, Global Non-CO2 Greenhouse Gas Emission Projections & Mitigation Potential: 2020-2080. For further insights into mitigation strategies specifically within the U.S. forestry and agriculture sectors, refer to the latest Climate Economic Analysis report on Greenhouse Gas Mitigation Potential in U.S. Forestry and Agriculture.
Emissions by Country
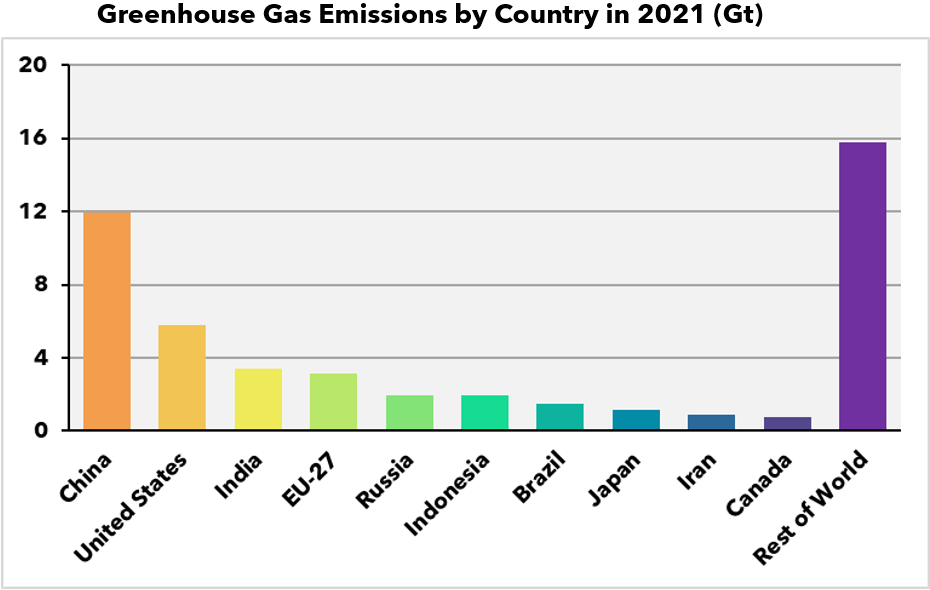
In 2020, the top ten greenhouse gas emitters were China, the United States, India, the European Union, Russia, Indonesia, Brazil, Japan, Iran, and Canada. These data include CO2, CH4, N2O, and fluorinated gas emissions from energy, agriculture, forestry and land use change, industry, and waste. Together, these top ten countries represent approximately 67% of total greenhouse gas emissions in 2020.
Emissions and sinks related to changes in land use are not included in these estimates. However, changes in land use can be important: estimates indicate that net global greenhouse gas emissions from agriculture, forestry, and other land use were approximately 12 billion metric tons of CO2 equivalent,[2] or about 21% of total global greenhouse gas emissions.[3] In areas such as the United States and Europe, changes in land use associated with human activities have the net effect of absorbing CO2, partially offsetting the emissions from deforestation in other regions.
References
1. IPCC (2022), Emissions Trends and Drivers. In IPCC, 2022: Climate Change 2022: Mitigation of Climate Change. Contribution of Working Group III to the Sixth Assessment Report of the Intergovernmental Panel on Climate Change. Cambridge University Press, Cambridge, UK and New York, NY, USA. doi: 10.1017/9781009157926.004
2. Jia, G., E. Shevliakova, P. Artaxo, N. De Noblet-Ducoudré, R. Houghton, J. House, K. Kitajima, C. Lennard, A. Popp, A. Sirin, R. Sukumar, L. Verchot, 2019: Land–climate interactions. In: Climate Change and Land: an IPCC special report on climate change, desertification, land degradation, sustainable land management, food security, and greenhouse gas fluxes in terrestrial ecosystems [P.R. Shukla, J. Skea, E. Calvo Buendia, V. Masson-Delmotte, H.-O. Pörtner, D.C. Roberts, P. Zhai, R. Slade, S. Connors, R. van Diemen, M. Ferrat, E. Haughey, S. Luz, S. Neogi, M. Pathak, J. Petzold, J. Portugal Pereira, P. Vyas, E. Huntley, K. Kissick, M, Belkacemi, J. Malley, (eds.)]. https://doi.org/10.1017/9781009157988.004
3. U.S. Energy Information Administration, Annual Energy Outlook 2021, (February 2021), www.eia.gov/aeo