
Get EasyRSEI
EasyRSEI is an easy-to-use dashboard that provides easy access to 11 years of results (2007-2017) from EPA's Risk-Screening Environmental Indicators (RSEI) model. A separate dashboard is available for users interested in all years of data.
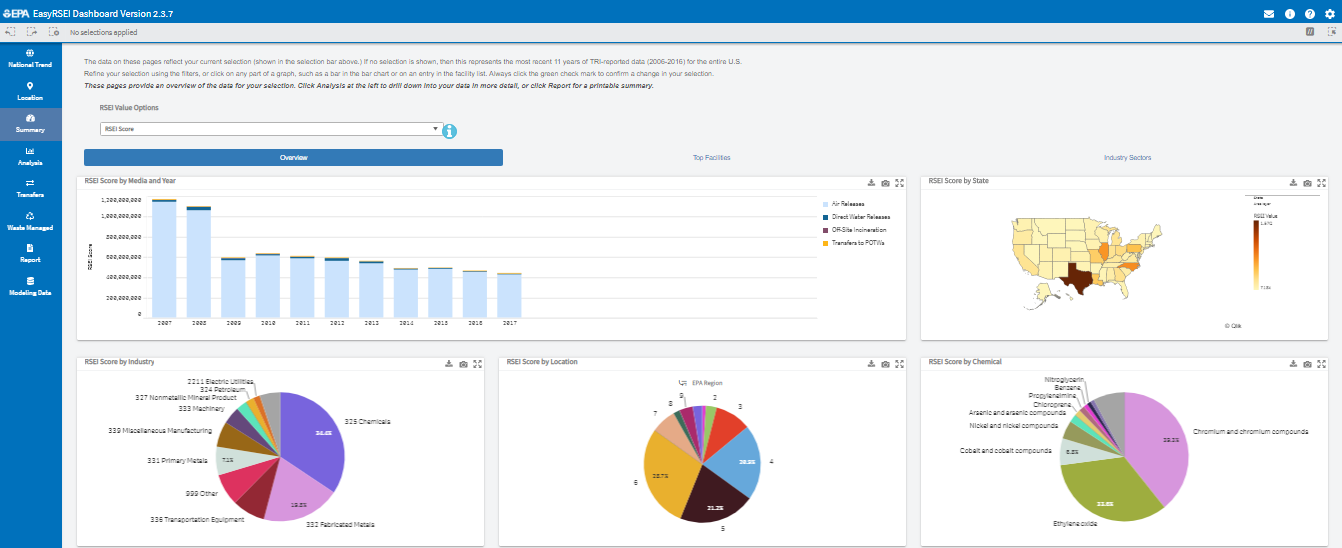
With EasyRSEI, you can browse through charts, maps, and tables and select the data you are interested in for specific facilities, locations, chemicals and years. Screenshots and data can be easily exported from EasyRSEI. The EasyRSEI Dashboard is easily accessible through any browser and device by using the Qlik Sense® platform.
EasyRSEI Dashboard
This version of EasyRSEI contains results from RSEI Version 2.3.7. Each new version of RSEI (and EasyRSEI) incorporates the latest Toxics Release Inventory (TRI) data, as well as changes to the input data and the methodology used to process the data and calculate the results.
You may separately download the supporting information, including the methodology, the toxicity spreadsheet, the pchem spreadsheet, and the technical appendices on the RSEI documentation and help page. EasyRSEI online help is also available.
Review how RSEI should be used.
What is new in RSEI Version 2.3.7
Each new version of RSEI incorporates the latest TRI data, as well as changes to the input data and the methodology used to process the data and present the results. The following changes were made in Version 2.3.7:
- Includes TRI Reporting Years 1988-2017. Note that EasyRSEI by default only contains 2007-2017; a separate dashboard contains the full dataset.
- Toxicity weights have been updated with the most recent toxicity data.
- The off-site database has been improved, with more precise locations for larger off-site facilities, and better matching of facilities.